
What is a Client Executive Summary report?
The Client Executive Summary report is a powerful tool designed to streamline discussions with your clients during regular business reviews.

With the Client Executive Summary report, you can communicate the effectiveness of your data protection services and provide your clients with the insights they need to make informed decisions. The report showcases the value delivered to your clients by offering two distinct levels of detail:
- Summary Only: Provides executive-level statistics, such as the number of protected systems, the estimated Recovery Time Objective (RTO), and the total amount of data which has been backed up.
- Protected System Listing: Offers a technician-level listing of each client's protected systems, including the backup health history for a selected period of time, AutoVerify results and the latest BootVM screenshot.


How to generate the Client Executive Summary report
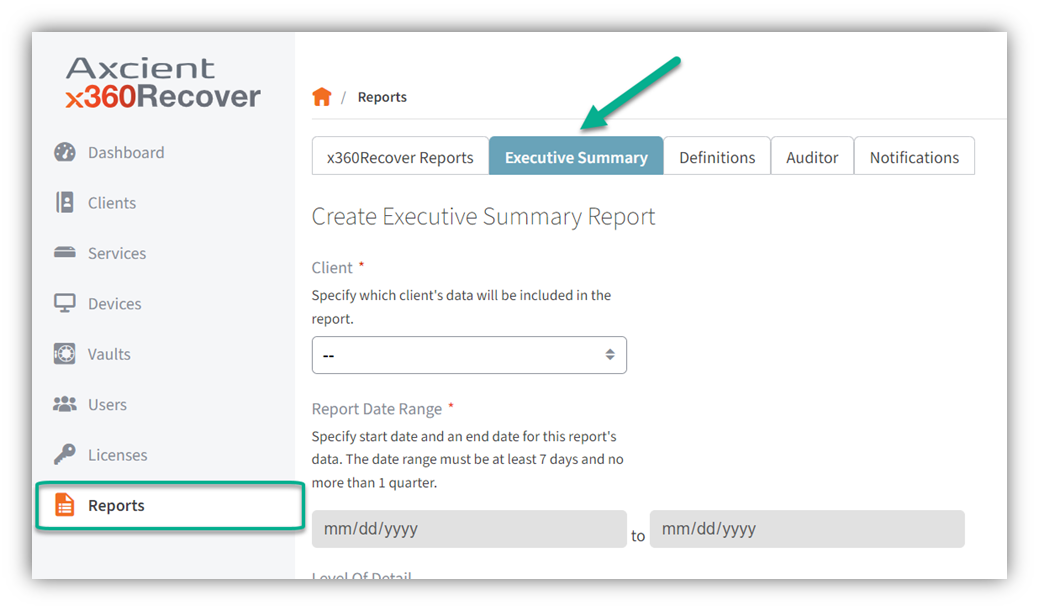
STEP 1. Log in to your x360Portal and open your x360Recover dashboard.
From the Reports page, select the Executive Summary tab.
STEP 2. Select a Client
STEP 3. Define the Report Schedule by selecting either Generate Now or Scheduled Delivery

- Generate Now: A report will be generated immediately that can be downloaded so you can manually share results.
- Scheduled Delivery: A report will be scheduled on a recurring basis, so you can send it to specified recipients


STEP 4. If selected 'Generate Now', define Report Date Range
Specify the start date and end date for this report.

If you selected Scheduled Delivery, this is where you can set up the delivery frequency.
STEP 5. Define Delivery Frequency

Select your preferred delivery frequency
STEP 6. Select the desired Level of Detail
Th level of detail can be either
- Summary Only or
- Protected System Listing

STEP 7. Click Preview Report
Note: The report will take longer to generate for clients with large numbers of protected systems, or if a date range greater than one month is selected.

STEP 8. (Optional) From the Preview page, you can choose to add custom comments or instructions for your clients and select their estimated internet speed for RTO estimation.
STEP 9. If you selected 'Scheduled Delivery' in STEP 3, Add Report Recipients
Add up to ten recipients, by entering their emails here and clicking Submit.

STEP 10. If you selected 'Scheduled Delivery' in STEP 3, remember to click the Schedule Report button. If you were looking to generate and download immediately, go back to STEP 3 and select 'Generate Now'.

STEP 11. If you you selected 'Generate Now' in STEP 3, click the Download PDF button, and then review the results with your client.


Definitions of datapoints:
Summary Only Datapoint |
Definition |
Average Backup Health Score |
Sum of seconds each protected system spent in “NORMAL” state divided by the total amount of seconds in the reporting period for each protected system |
Total data backed up |
Total size of all protected systems backed up as of the end of the reporting period |
Appliance/Local Cache storage |
Total amount of data stored in the client’s appliances/Local Cache |
Successful backups |
Number of successful backup attempts in the report period & total number of backup attempts |
Average backups per day |
Total successful backups divided by the number of days in the reporting period |
Total restore points |
Total number of restore points available since client creation |
Average data per Server/Workstation |
Average size of all backed-up servers/workstations |
Estimated time to recover |
Estimated time to recover an average protected system’s data via FTPS. See the RTO Calculator at https://info.axcient.com/rto-calculator |
Estimated time to virtualize |
Estimated time to virtualize an average protected system. See the RTO Calculator at https://info.axcient.com/rto-calculator |
Protected system counts |
Total number of protected systems at the end of the report period. “Cloud Backup” represents Direct-to-Cloud systems, while “On-Site” represents appliance-based systems |
Storage growth |
Total amount of data stored, divided between Appliance and Cloud (Axcient Cloud & Private Vaults), displayed over the report’s timeframe |
Protected systems health history |
Average Backup Health score per day/week of the report period, split between servers & workstations |
Protected System Datapoint |
Definition |
Health History |
The protected system’s average Backup Health Score per day (or per week, if report timeframe is longer than 1 month) |
Backup size |
The total size of the protected system at the end of the reporting period |
AutoVerify result |
Date & result of the last AutoVerify check performed for the protected system |
BootVM Screenshot |
Latest BootVM screenshot generated for the protected system |

SUPPORT | 800-352-0248
- Contact Axcient Support at https://partner.axcient.com/login or call 800-352-0248
- Have you tried our Support chat for quick questions?
- Free certification courses are available in the Axcient x360Portal under Training
- Subscribe to Axcient Status page for updates and scheduled maintenance
2079