

|
Essential User Guide |
Other resources:
What can you do with x360Recover Manager?
|
Frequently asked questions about x360Recover Manager (formerly RMC)
How can I access x360Recover Manager?
You have single-sign-on (SSO) access to x360Recover Manager through the x360 Portal Dashboard.
Where did the RMC go?
The Remote Access Console (RMC) was the centralized management dashboard previously used for BRC and Fusion products. The RMC has been integrated into x360Recover Manager, and Manager's dashboard now provides the tools previously available in the RMC.
Can I continue using the Global Management Portal (GMP)?
Yes; the GMP will continue to exist until all Direct-to-Cloud management functionality is fully available within Manager.
Can I perform client management and license provisioning from x360Recover Manager?
Yes! As of October 24, 2023, we've consolidated several services and tasks within x360Recover Manager. Get started here:
Can I create multiple admin user accounts in the x360Recover Manager?
When you create users in the Axcient x360 portal, they will each be granted automatic access to Manager. You can then adjust user privileges within Manager.
This chapter of the Essential User Guide details how to use this "single-pane-of-glass" to monitor and report clients, vaults, appliances, and protected systems.
In this section, you'll learn about
- What is x360Recover Manager (RMC)?
- Licenses in Manager (RMC)
- Client accounts in Manager (RMC)
- Configure settings in Manager (RMC)
- Reports in Manager (RMC)
- Users in Manager (RMC)
- Integrate Manager (RMC) with a PSA
- Health Dashboard - x360Recover
- Configure client health digest email - x360Recover
- Generate a Client Executive Summary report - x360Recover
- Billing overview - x360Recover
- License and billing management
- Cover Page - Monitor with x360Recover Manager
- x360Recover Manager (RMC)
Navigate x360Recover Manager
The x360Recover Manager (previously known as RMC) is a web-based platform accessible through your x360Portal account with single-sign-on (SSO).
The x360Recover Manager brings all x360Recover services together for one place to monitor health, configure settings, generate reports, and more.
This article explains each of x360Recover Manager's main pages. Details around configuration will be covered throughout this user guide section:

How to navigate:
1. Dashboard settings for x360Recover Manager
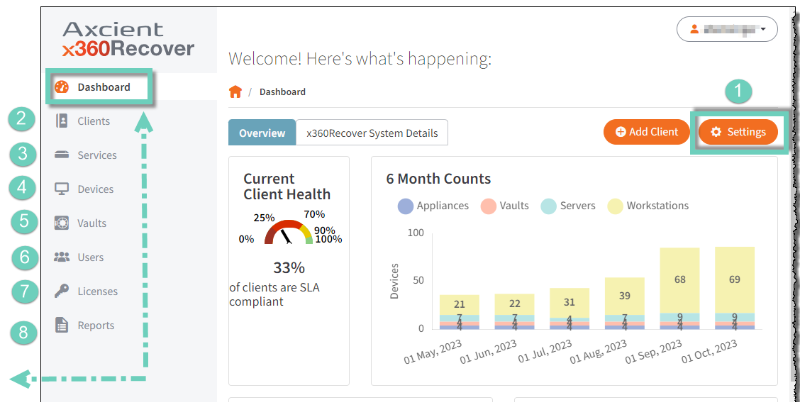
- Click the Settings button to configure organization-wide alerts and thresholds, notifications, and a PSA integration.
- Click the Clients link to view the Clients page, which lists all provisioned clients.
- Click the Services link to view the Services page, which lists all provisioned appliances.
- Click the Devices link to view the Devices page, which lists all provisioned devices, including workstations and servers.
- Click the Vaults link to view the Vaults page, including private vaults and the Axcient Cloud.
- Click the Users link to view, add, edit and manage users.
- Click the Licenses link add, allocate and manage licenses
- Click the Reports link to generate detailed summaries
Health Status Descriptions
- Activities of Interest—this panel lists important activities across all clients, services, and vaults. Each individual alert includes direct links to the corresponding activity, such as a virtualization or update.
- Requires Attention—this panel displays a list of clients that are in a Troubled state, usually because they have at least one device outside of the configured protection threshold. Devices that have failed the cloud replication will be included as well.
- Warning—this panel lists clients with devices that have lost connectivity for an extended period of time as configured in the protection policy. This panel will also display alerts when a local or cloud replication job completes with warnings.
- Protected as Expected—this panel lists clients that are healthy and do not need attention at this time. Click Browse to view each client or vault.
2. Client settings for x360Recover Manager
2. Clients
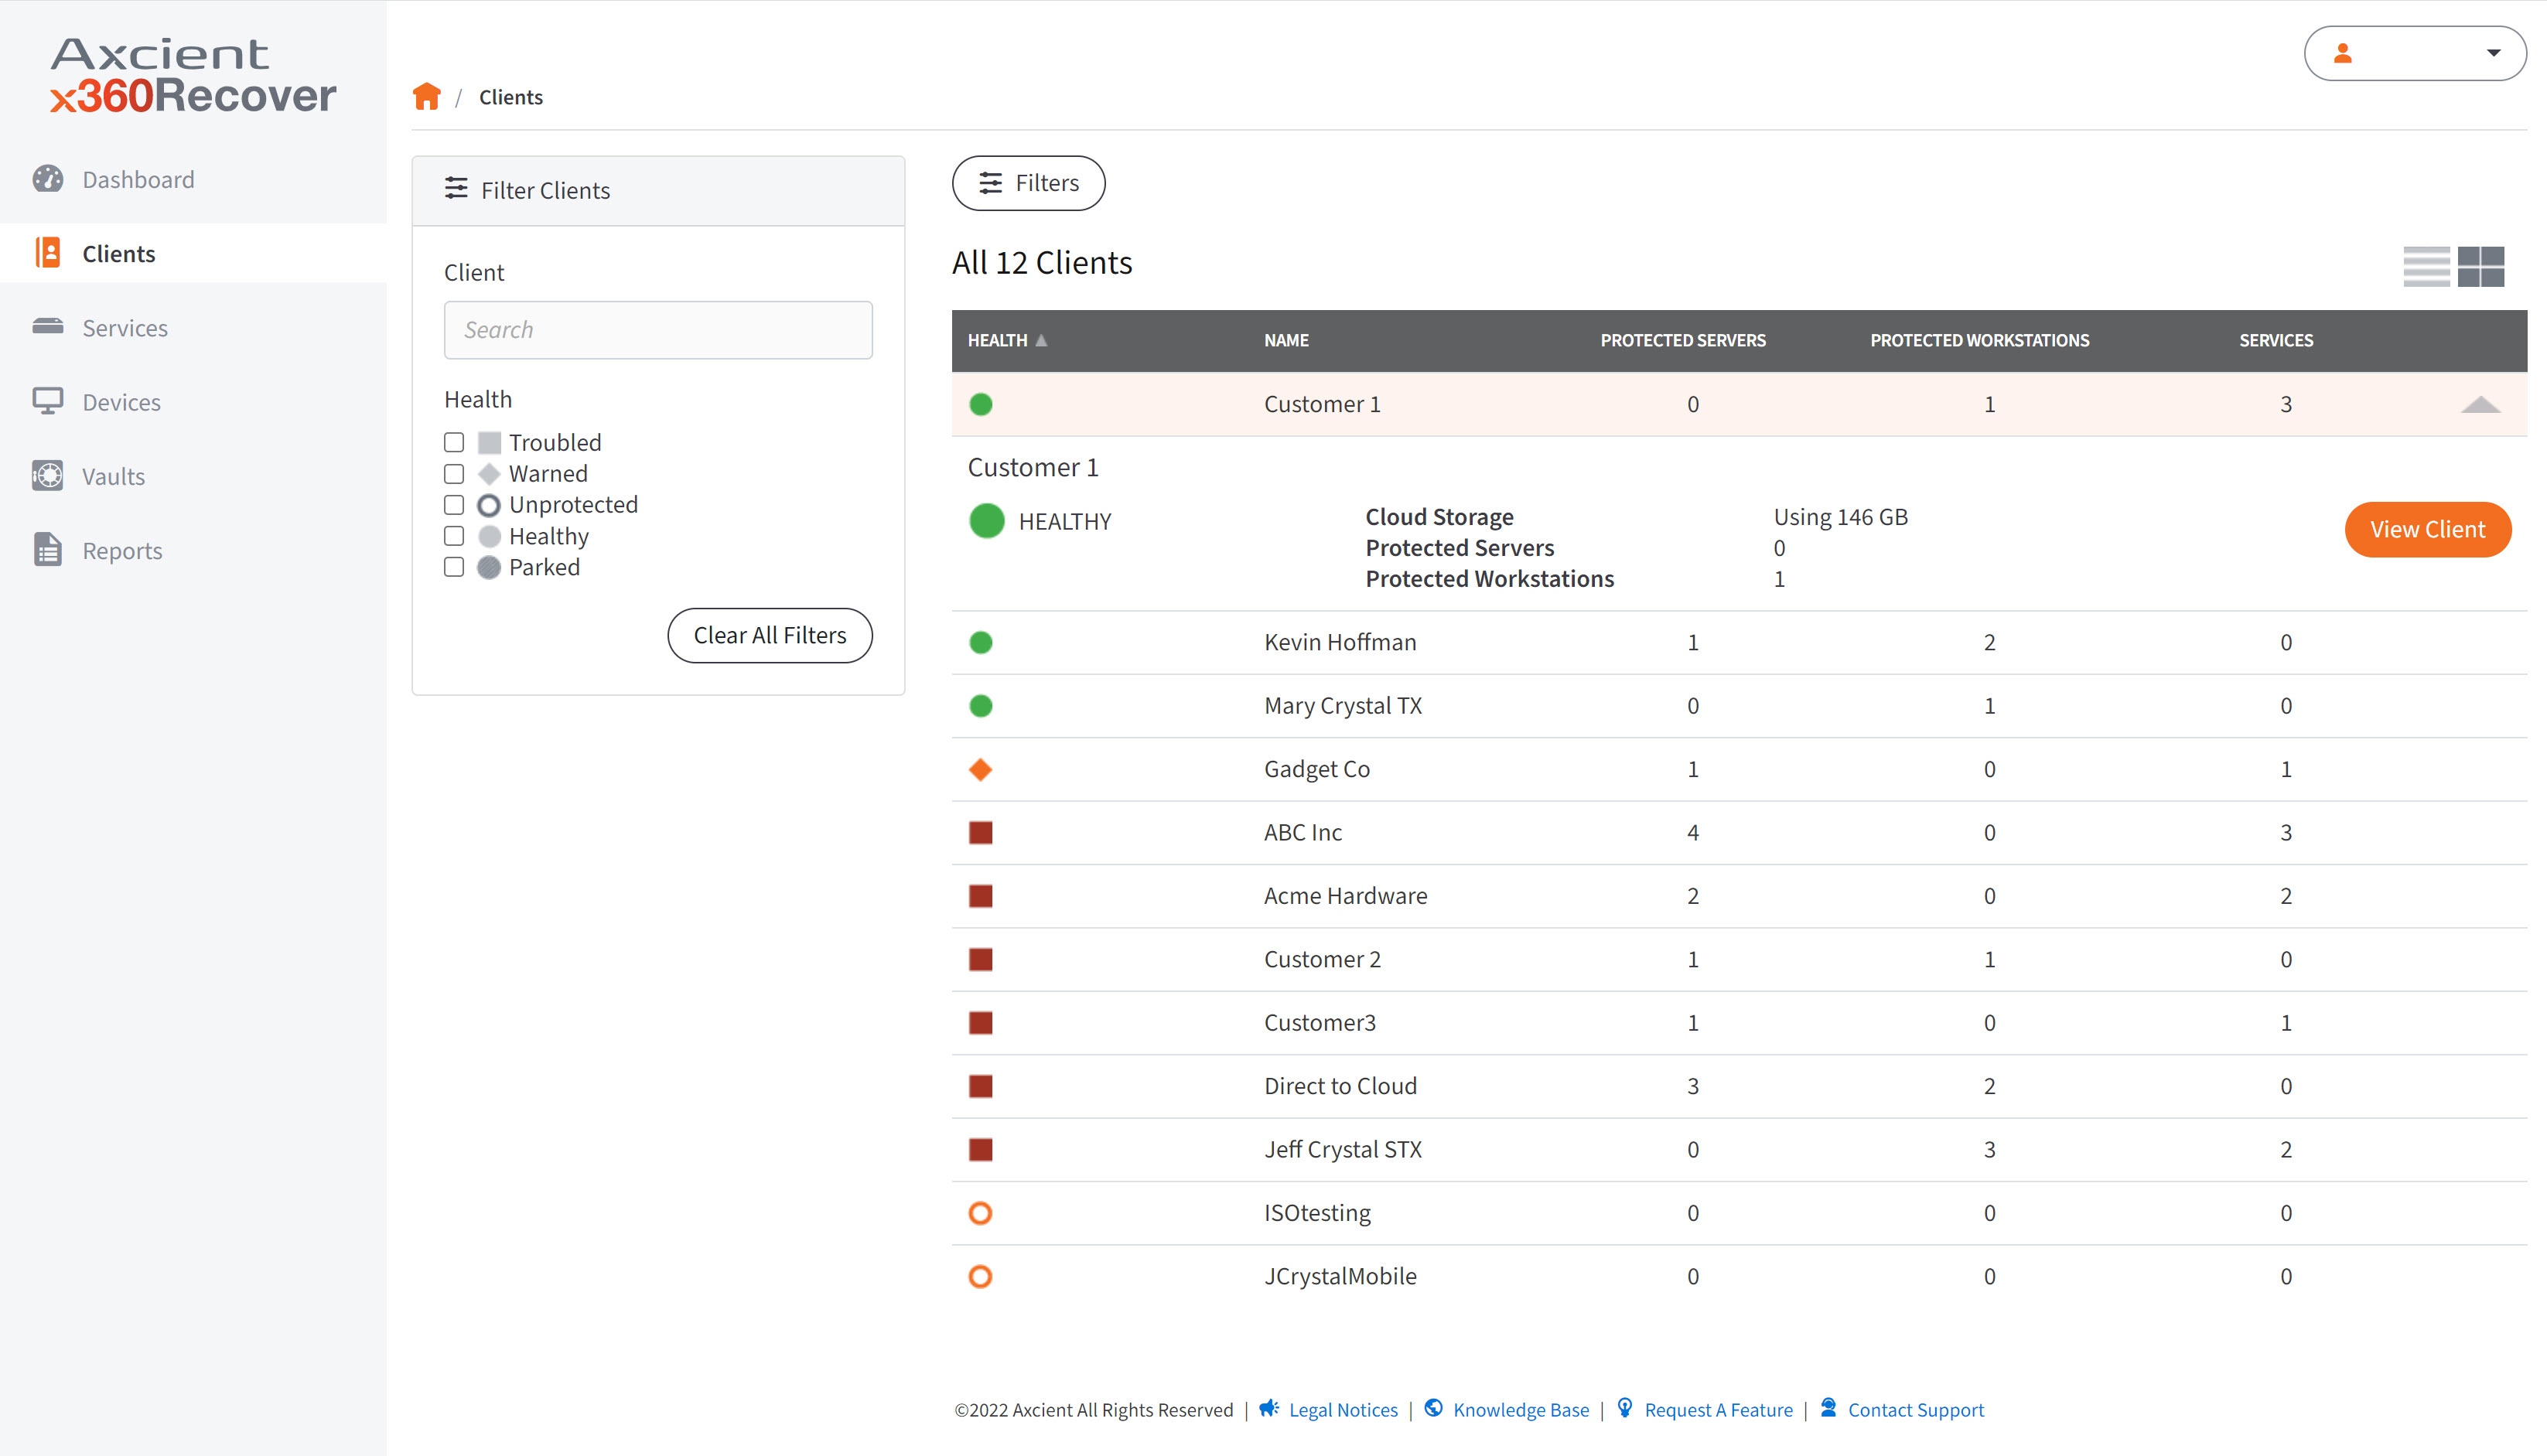
The Clients page provides a summary of clients registered under your account. The list view offers at-a-glance information such as health status, protected servers and workstations, and number of services.
On the left-hand side of the page is a search and filter tool, which you can use to sort through the clients list. You can click the Filters button above the table to hide this tool. The clients list can be sorted by any column, such as by Health status. Click the icons on the top right to switch between List and Grid views.
Click into a client Name to view its Client Details page. Alternatively, click anywhere else on the row to expand and view more information. Click the View Client button to view the Client Details page.
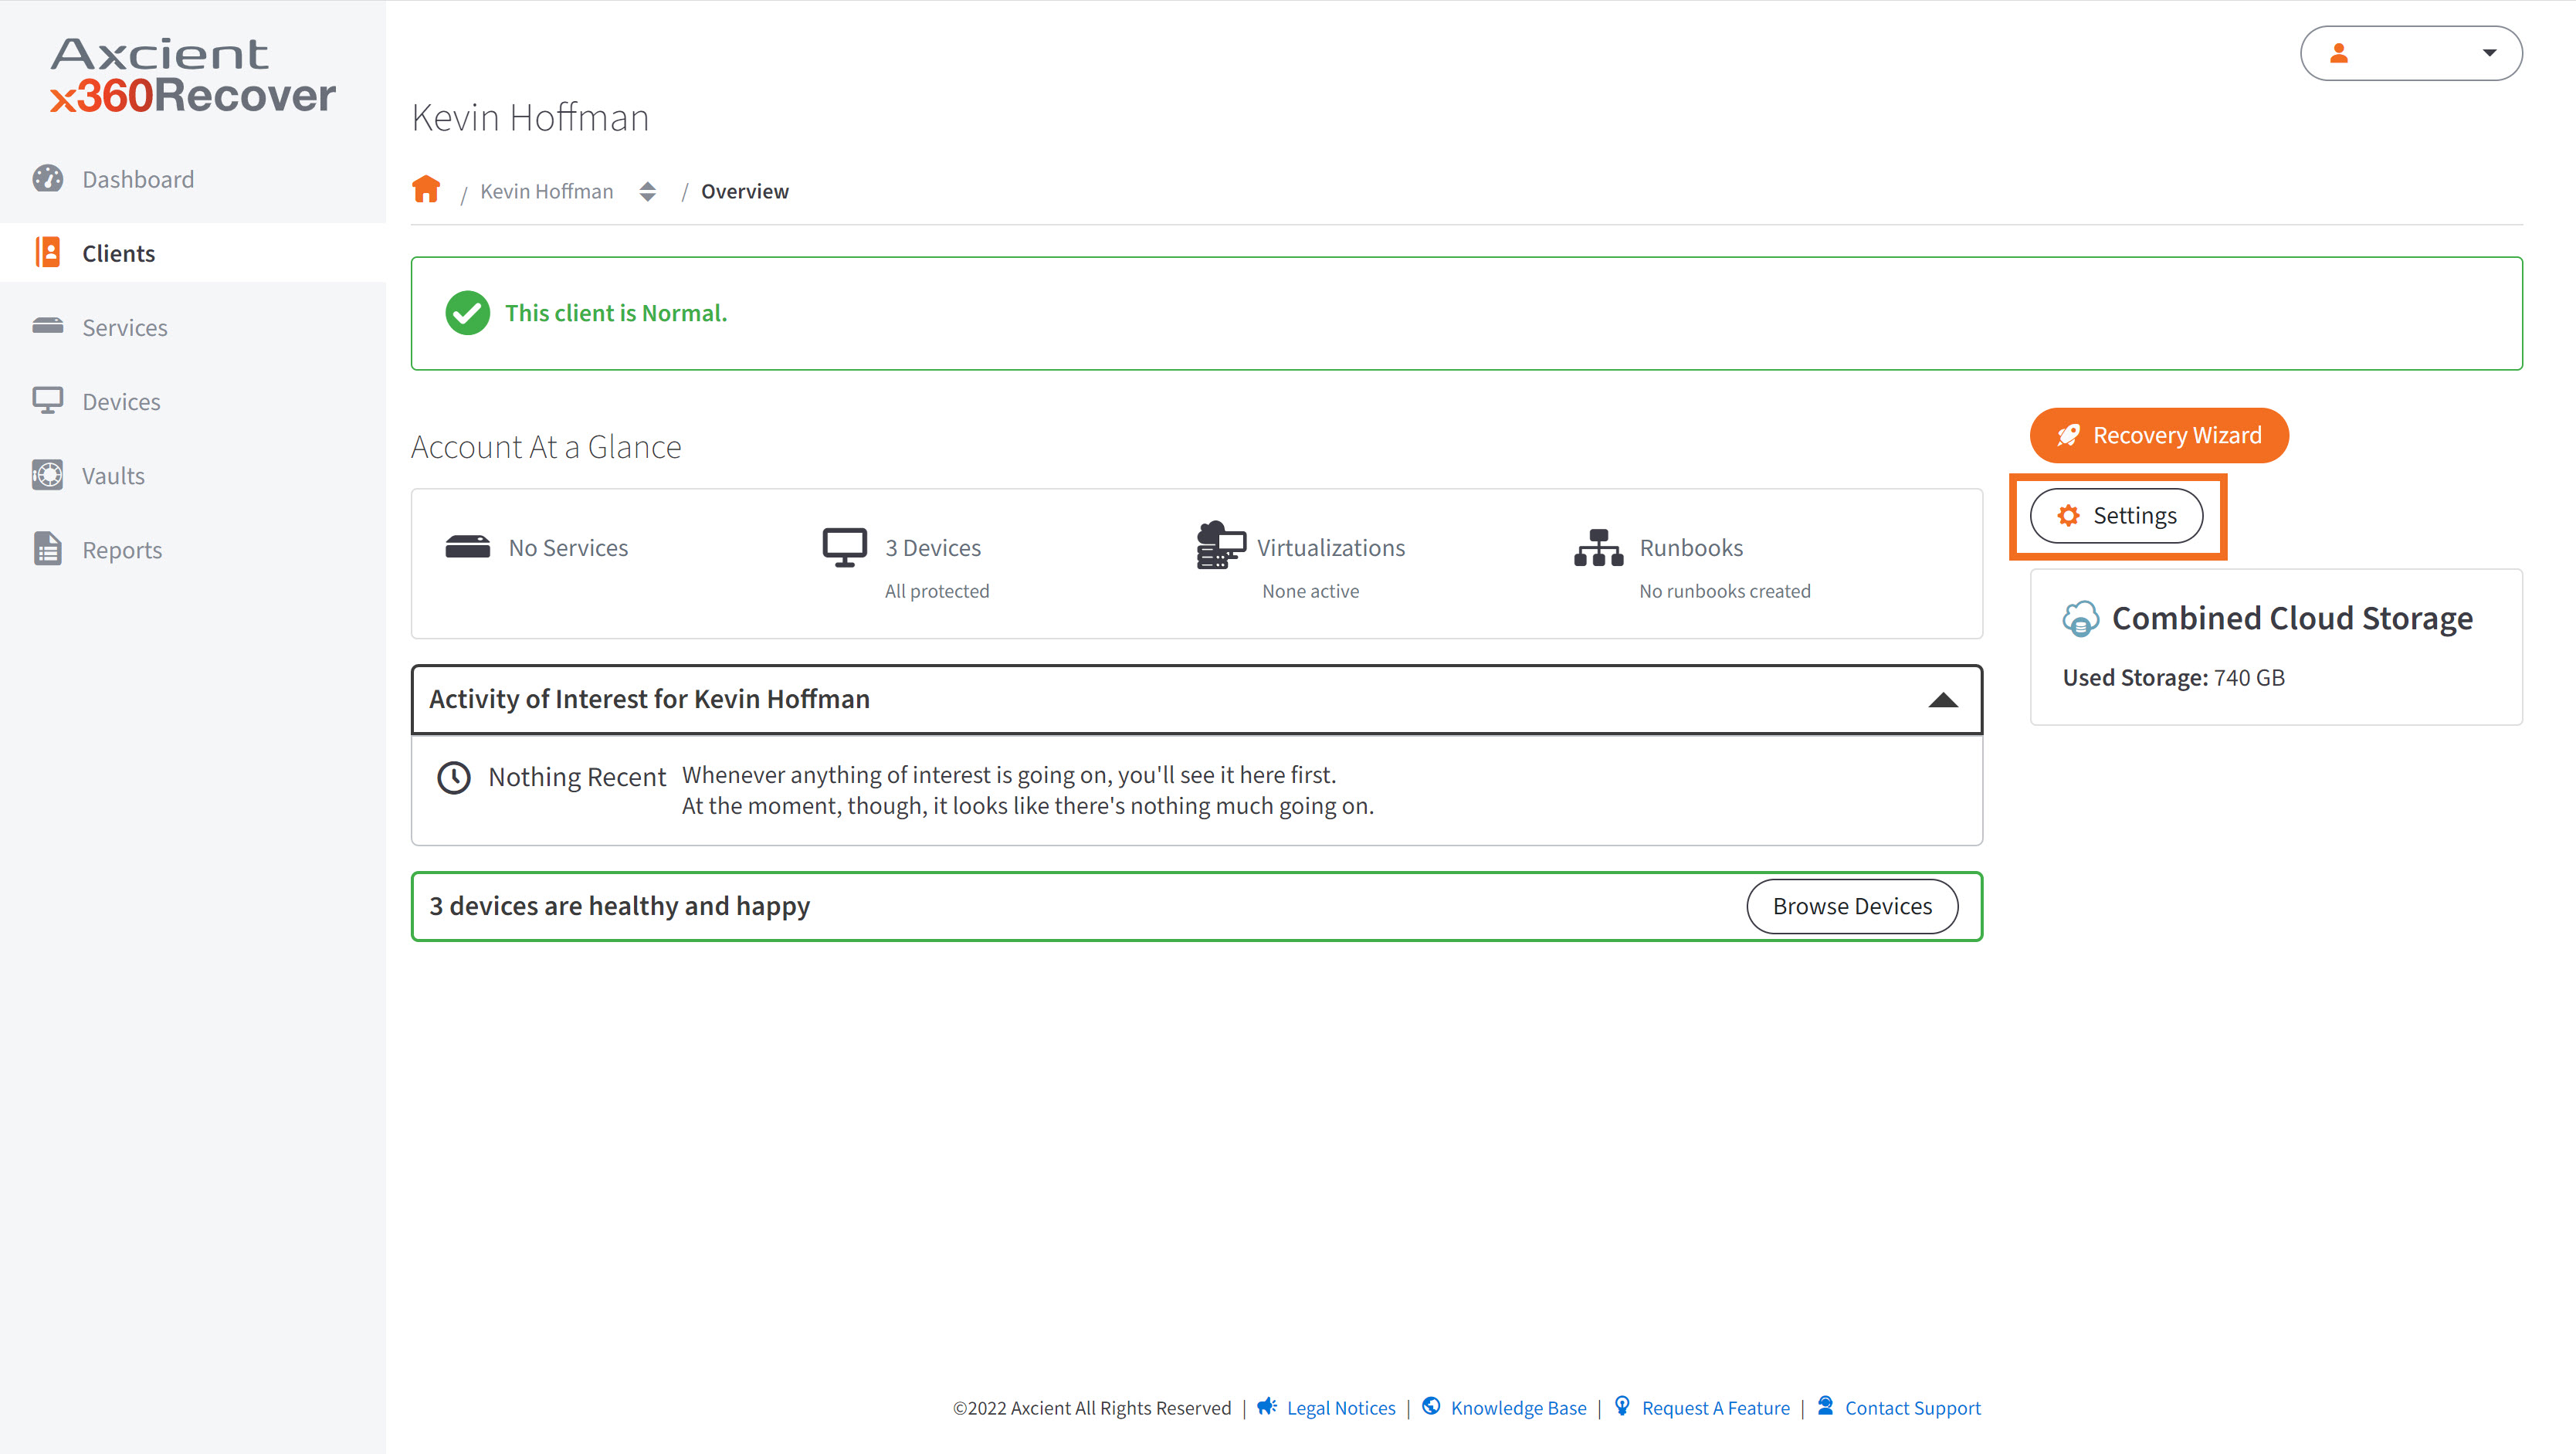
Client details
The Client Details page allows you to monitor a particular client and their devices. Click the Settings button to adjust the notification configurations or manage a PSA integration.
3. Service settings for x360Recover Manager
3. Services
The Services page provides a summary of all physical and virtual appliances registered to your organization. The list view offers at-a-glance information such as health status, tunnel status, and important identifying information.
On the left-hand side of the page is a search and filter tool, which you can use to sort through the list. You can click the Filters button above the table to hide this tool. The list can be sorted by any column, such as by Health status. Click the icons on the top right to switch between List and Grid views.
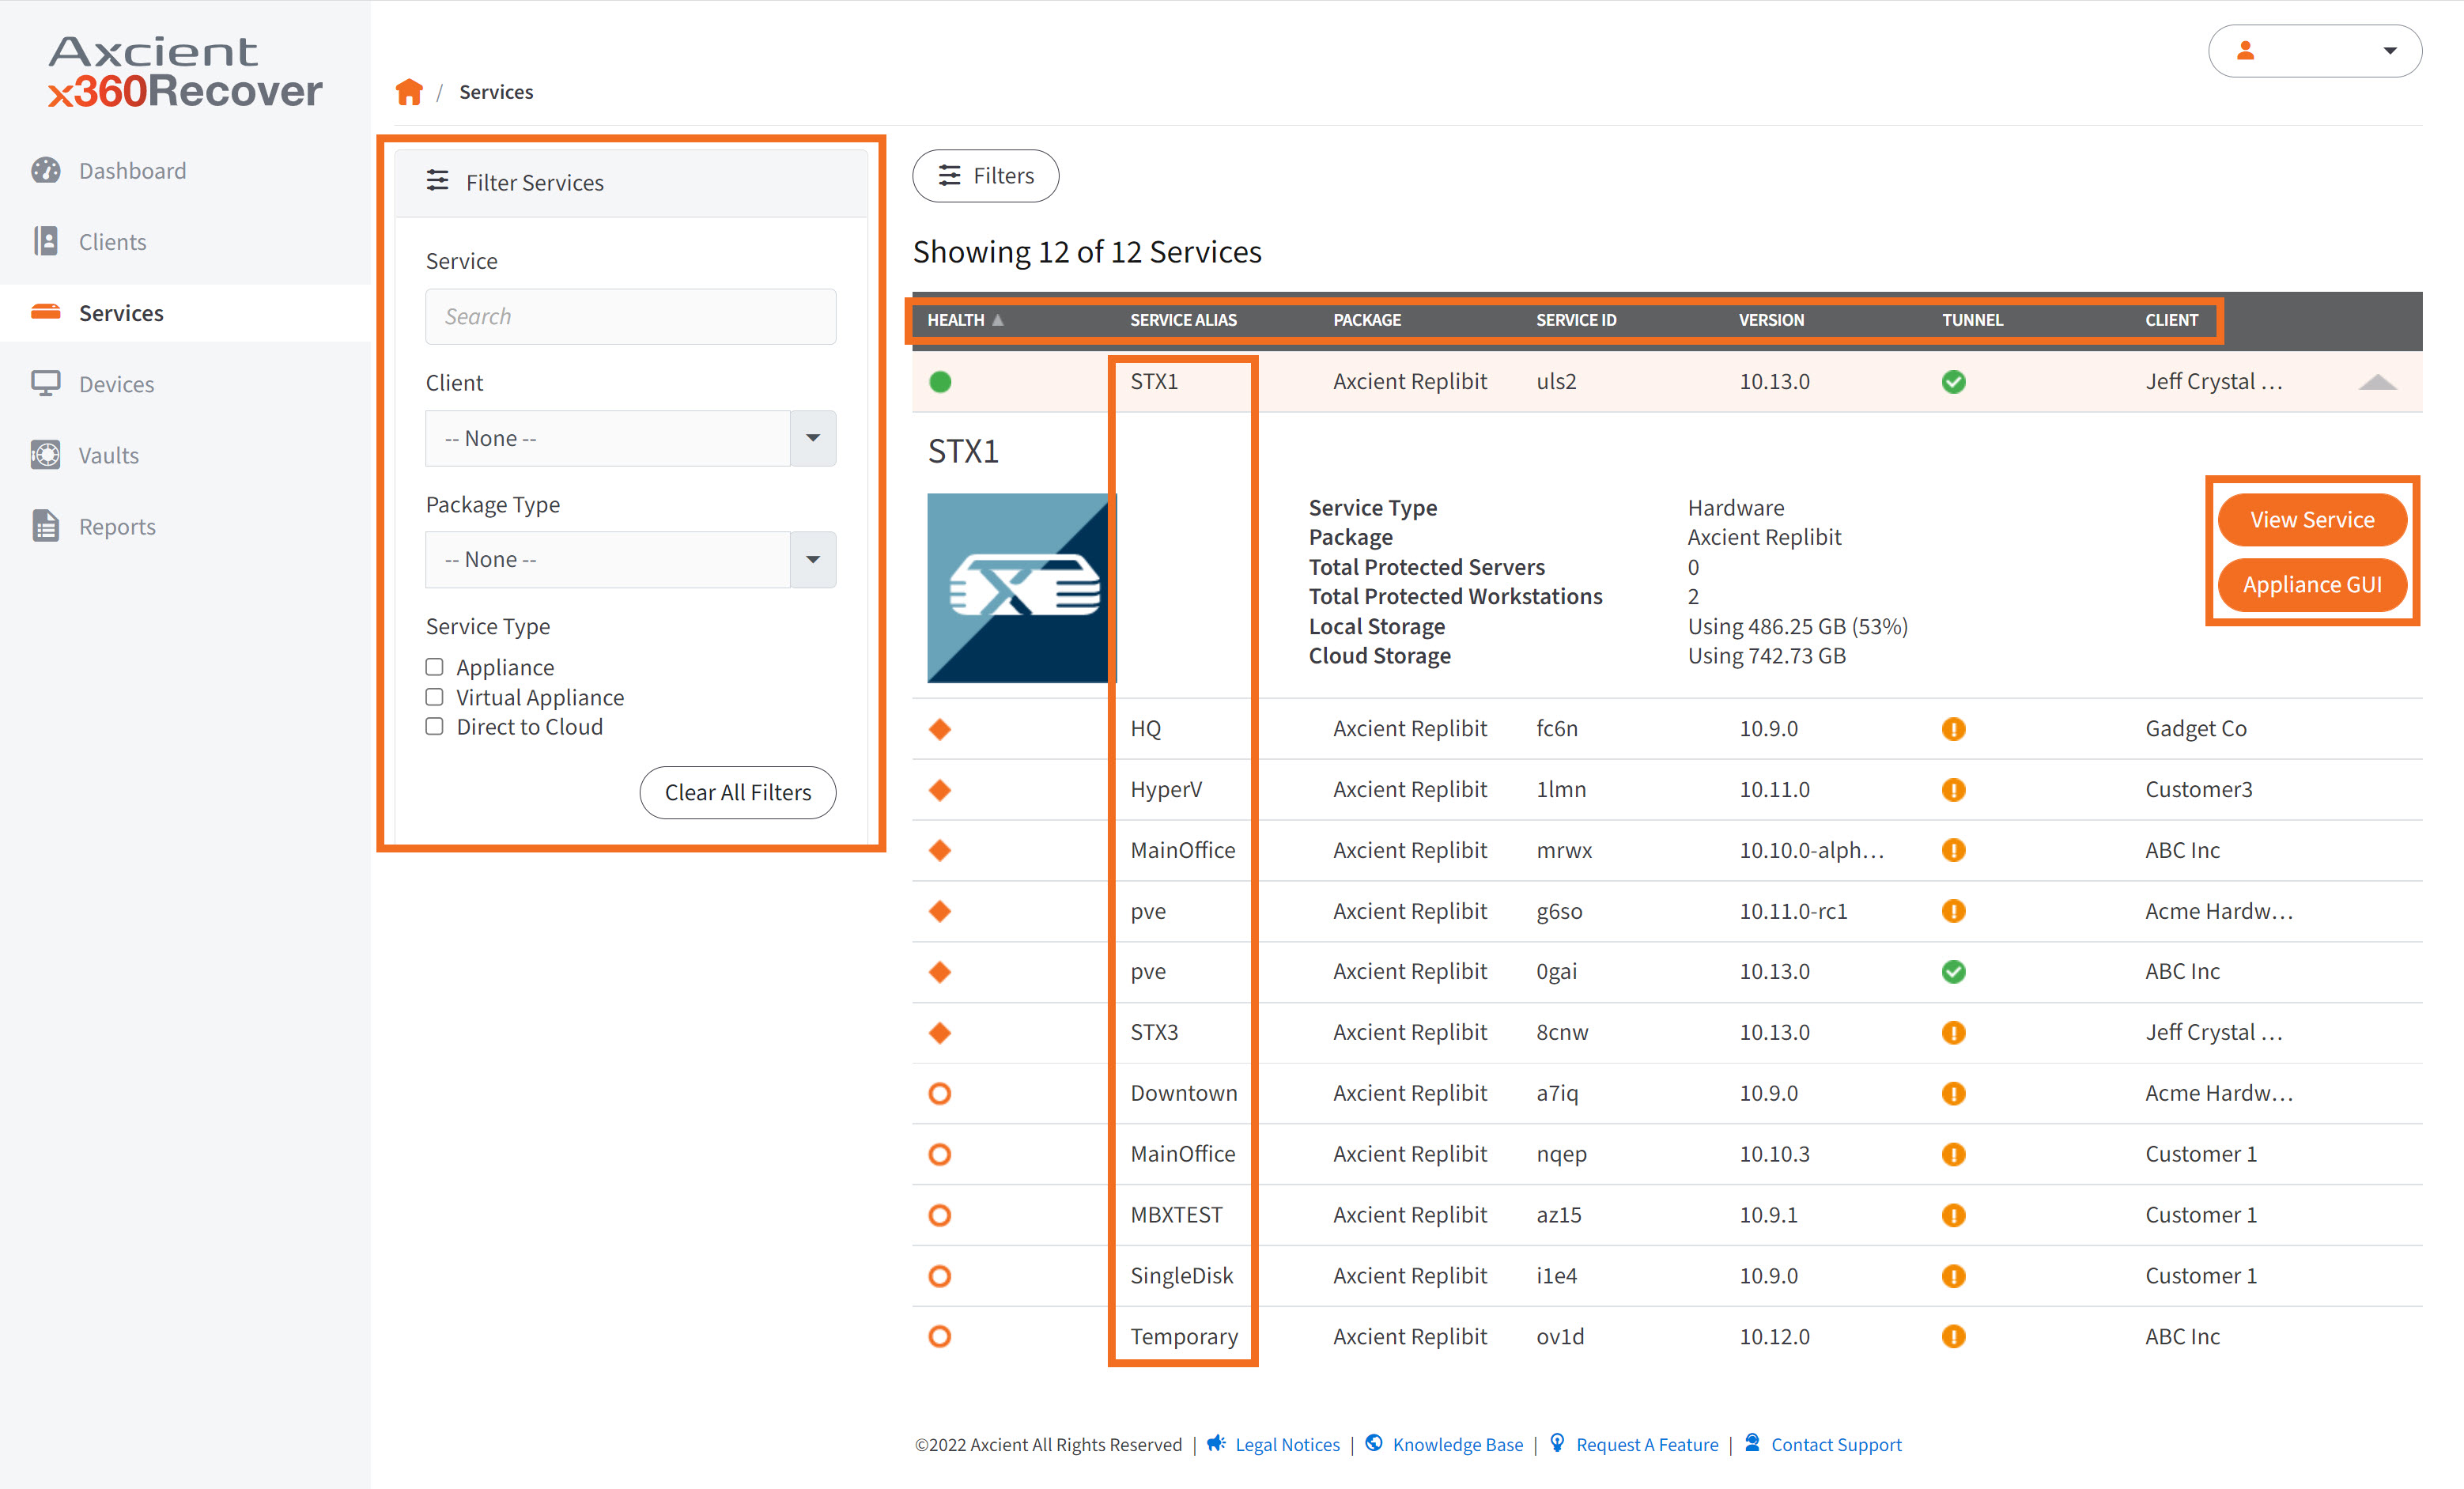
To view a Service Details page, click the Service Alias link.
Alternatively, click anywhere on the row to expand the row and view more details. Access the Service Details page by clicking the View Service button, or log into the appliance directly by clicking the Appliance GUI button.
Service details
The Service Details page allows you to configure service level SLA thresholds, view storage summaries, view entitlements, view a hardware description of the appliance, and more.
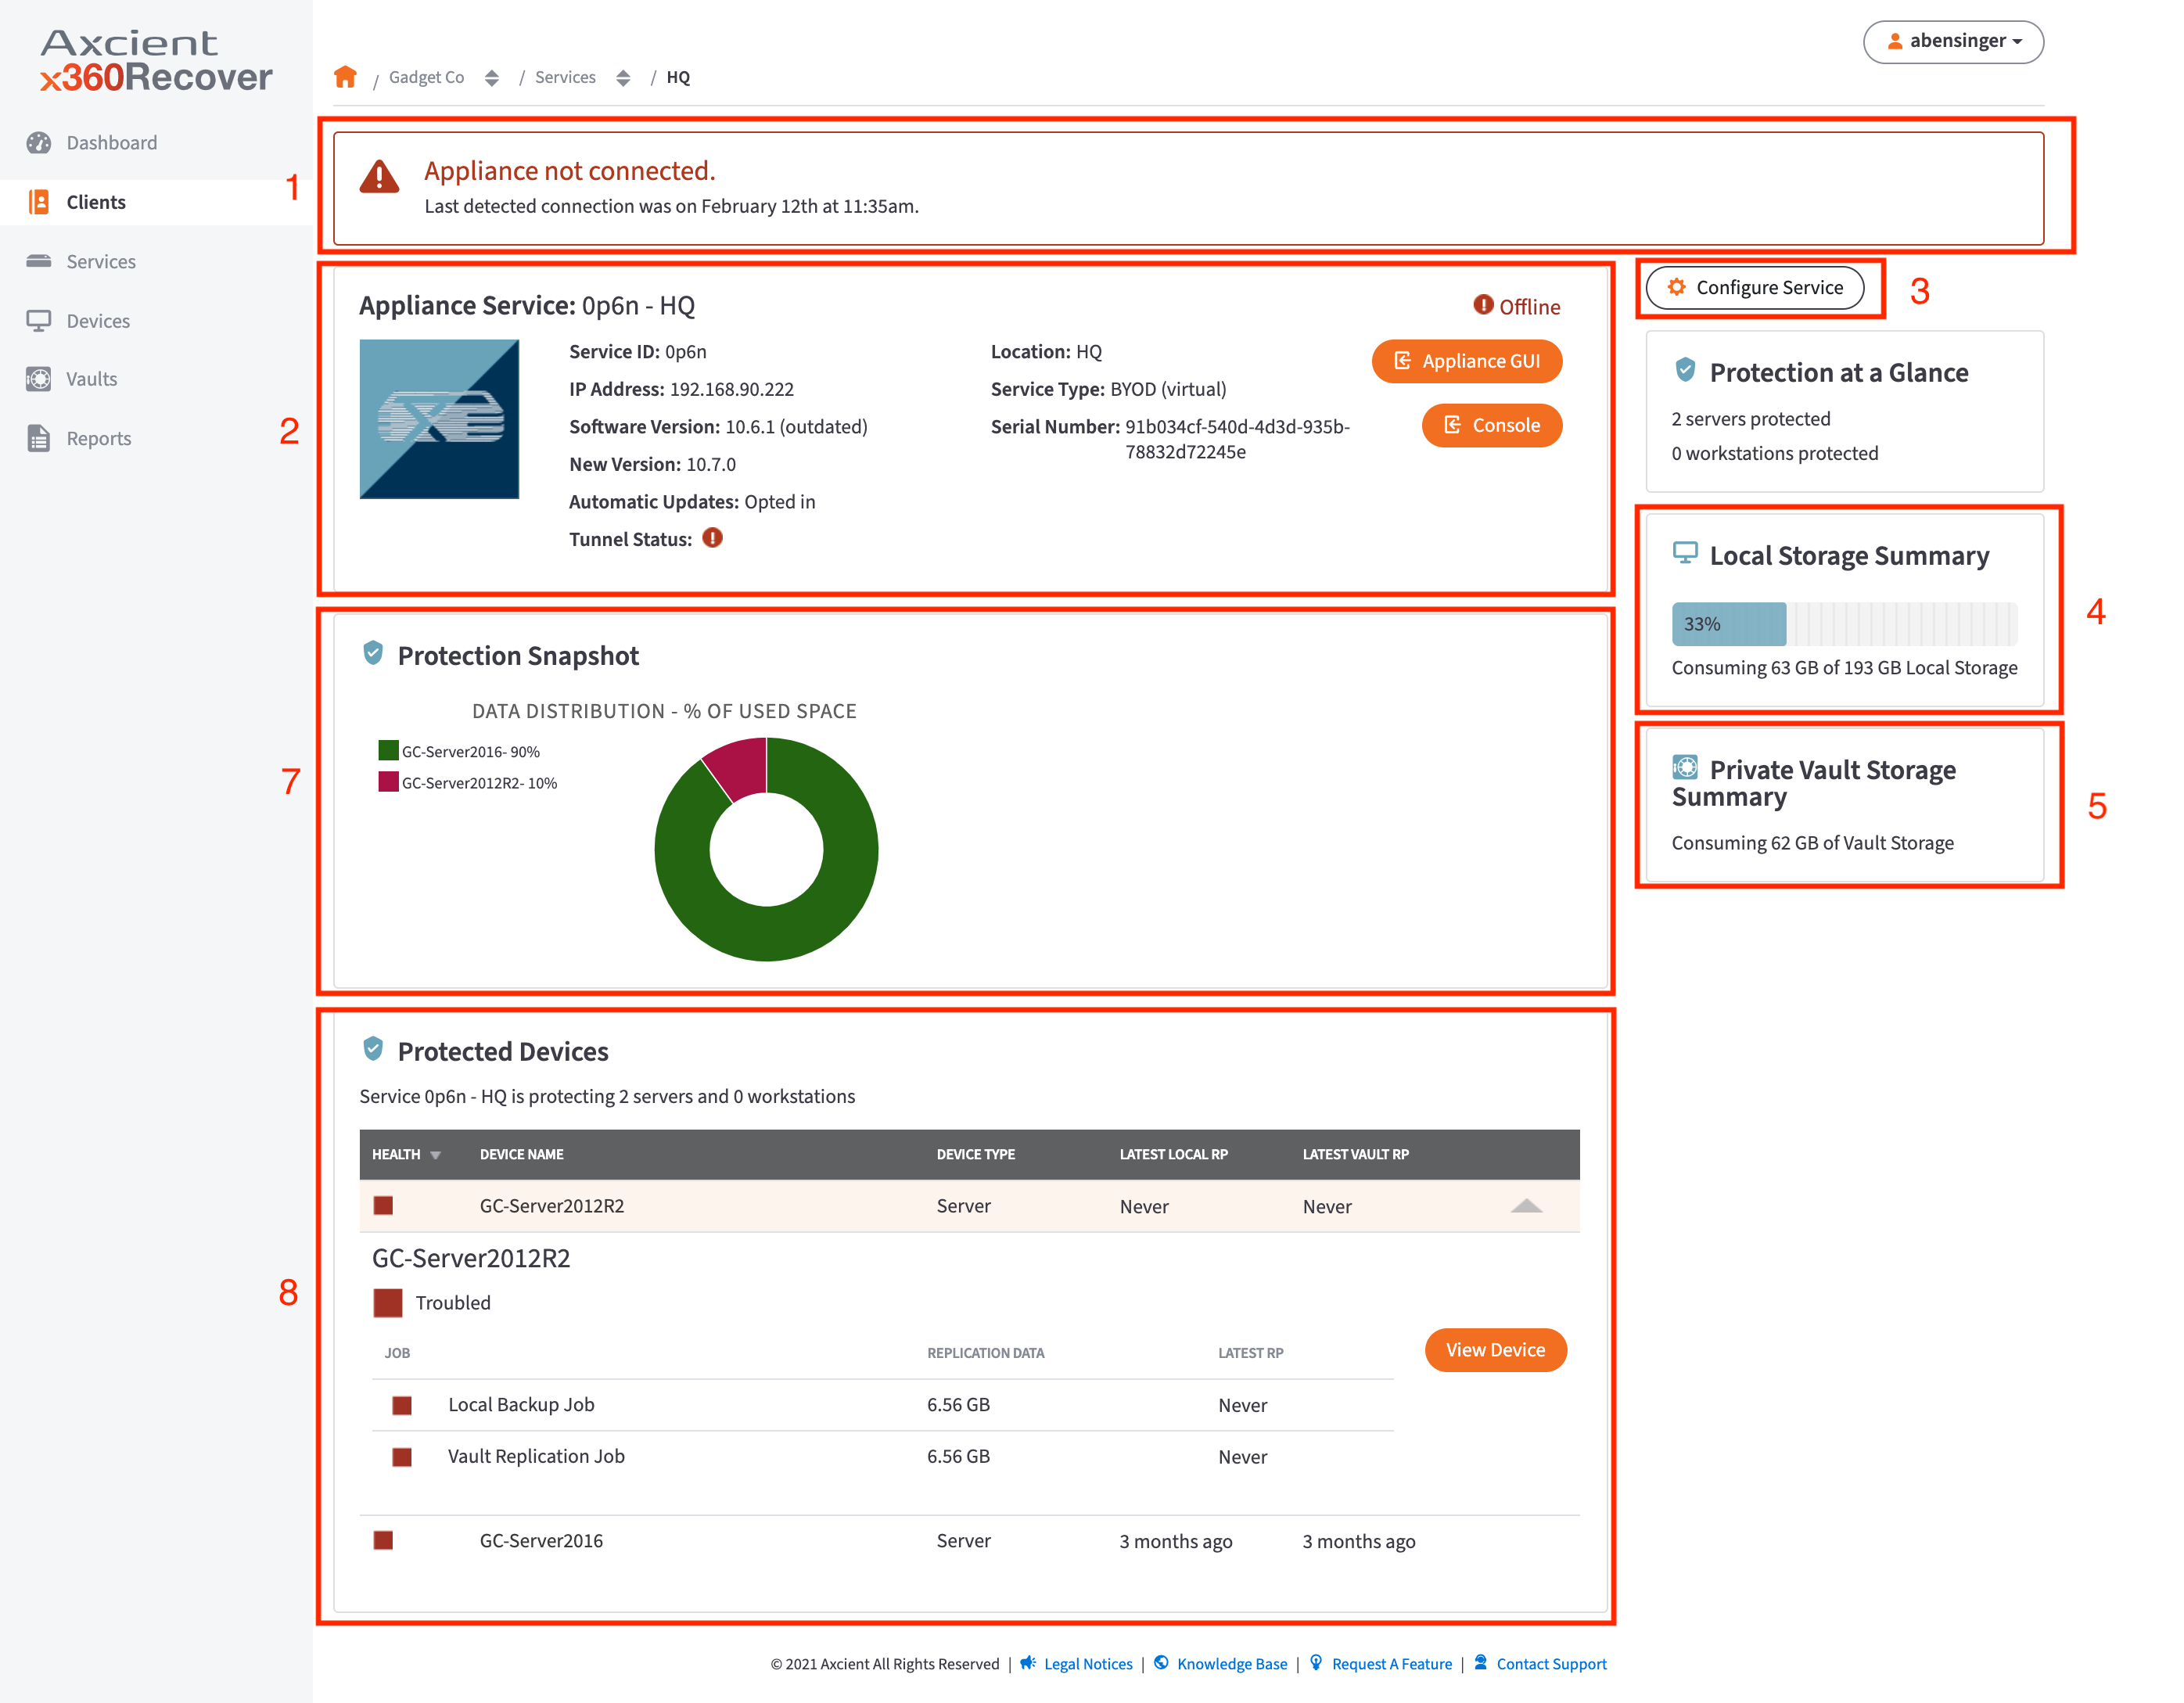
- Appliance Summary Message—This panel displays a message summarizing appliance storage.
- Appliance Service Details—This panel displays summary information for the appliance.
- Configure Service—This button launches the Configure Service page, where you can configure alerts and thresholds.
- Local Storage Summary—This panel displays a summary of the local storage usage.
- Private Vault Storage Summary—This panel displays a summary of Private Cloud Vault storage usage, if applicable.
- Cloud Storage Summary—This panel displays a summary of the Axcient Cloud Vault storage usage, if applicable.
- Protection Snapshot - This panel displays data distribution among protected devices.
- Device List—This panel displays a list of devices being protected. Click anywhere on the row to expand, then click the View Device button to view the Device Details page.
4. Device settings for x360Recover Manager
4. Devices
The Device List displays a list of devices, separated into tabs by health status. The health statuses are explained below:
- Troubled—devices that are outside of the Protection Policy Threshold for the freshest recovery point. These devices are marked with a red health status symbol.
- Warned—devices that are outside of the Protection Policy Threshold for loss of connectivity, or the most recent cloud replication occurred with errors. These devices are marked with an orange health status symbol.
- Healthy—devices that are within the Protection Policy Threshold and have had no cloud replication issues. These devices are marked with a green health status symbol.
- Parked—devices that have been previously protected and are still registered, but no replication jobs are currently running. These devices are essentially on standby.
- All Protected—devices protected by the Service regardless of health status.
- Unprotected Devices—devices registered to the appliance but not currently protected.
On the left-hand side of the page is a search and filter tool, which you can use to sort through the list. You can click the Filters button above the table to hide this tool. The list can be sorted by any column, such as by Health status. Click the icons on the top right to switch between List and Grid views.
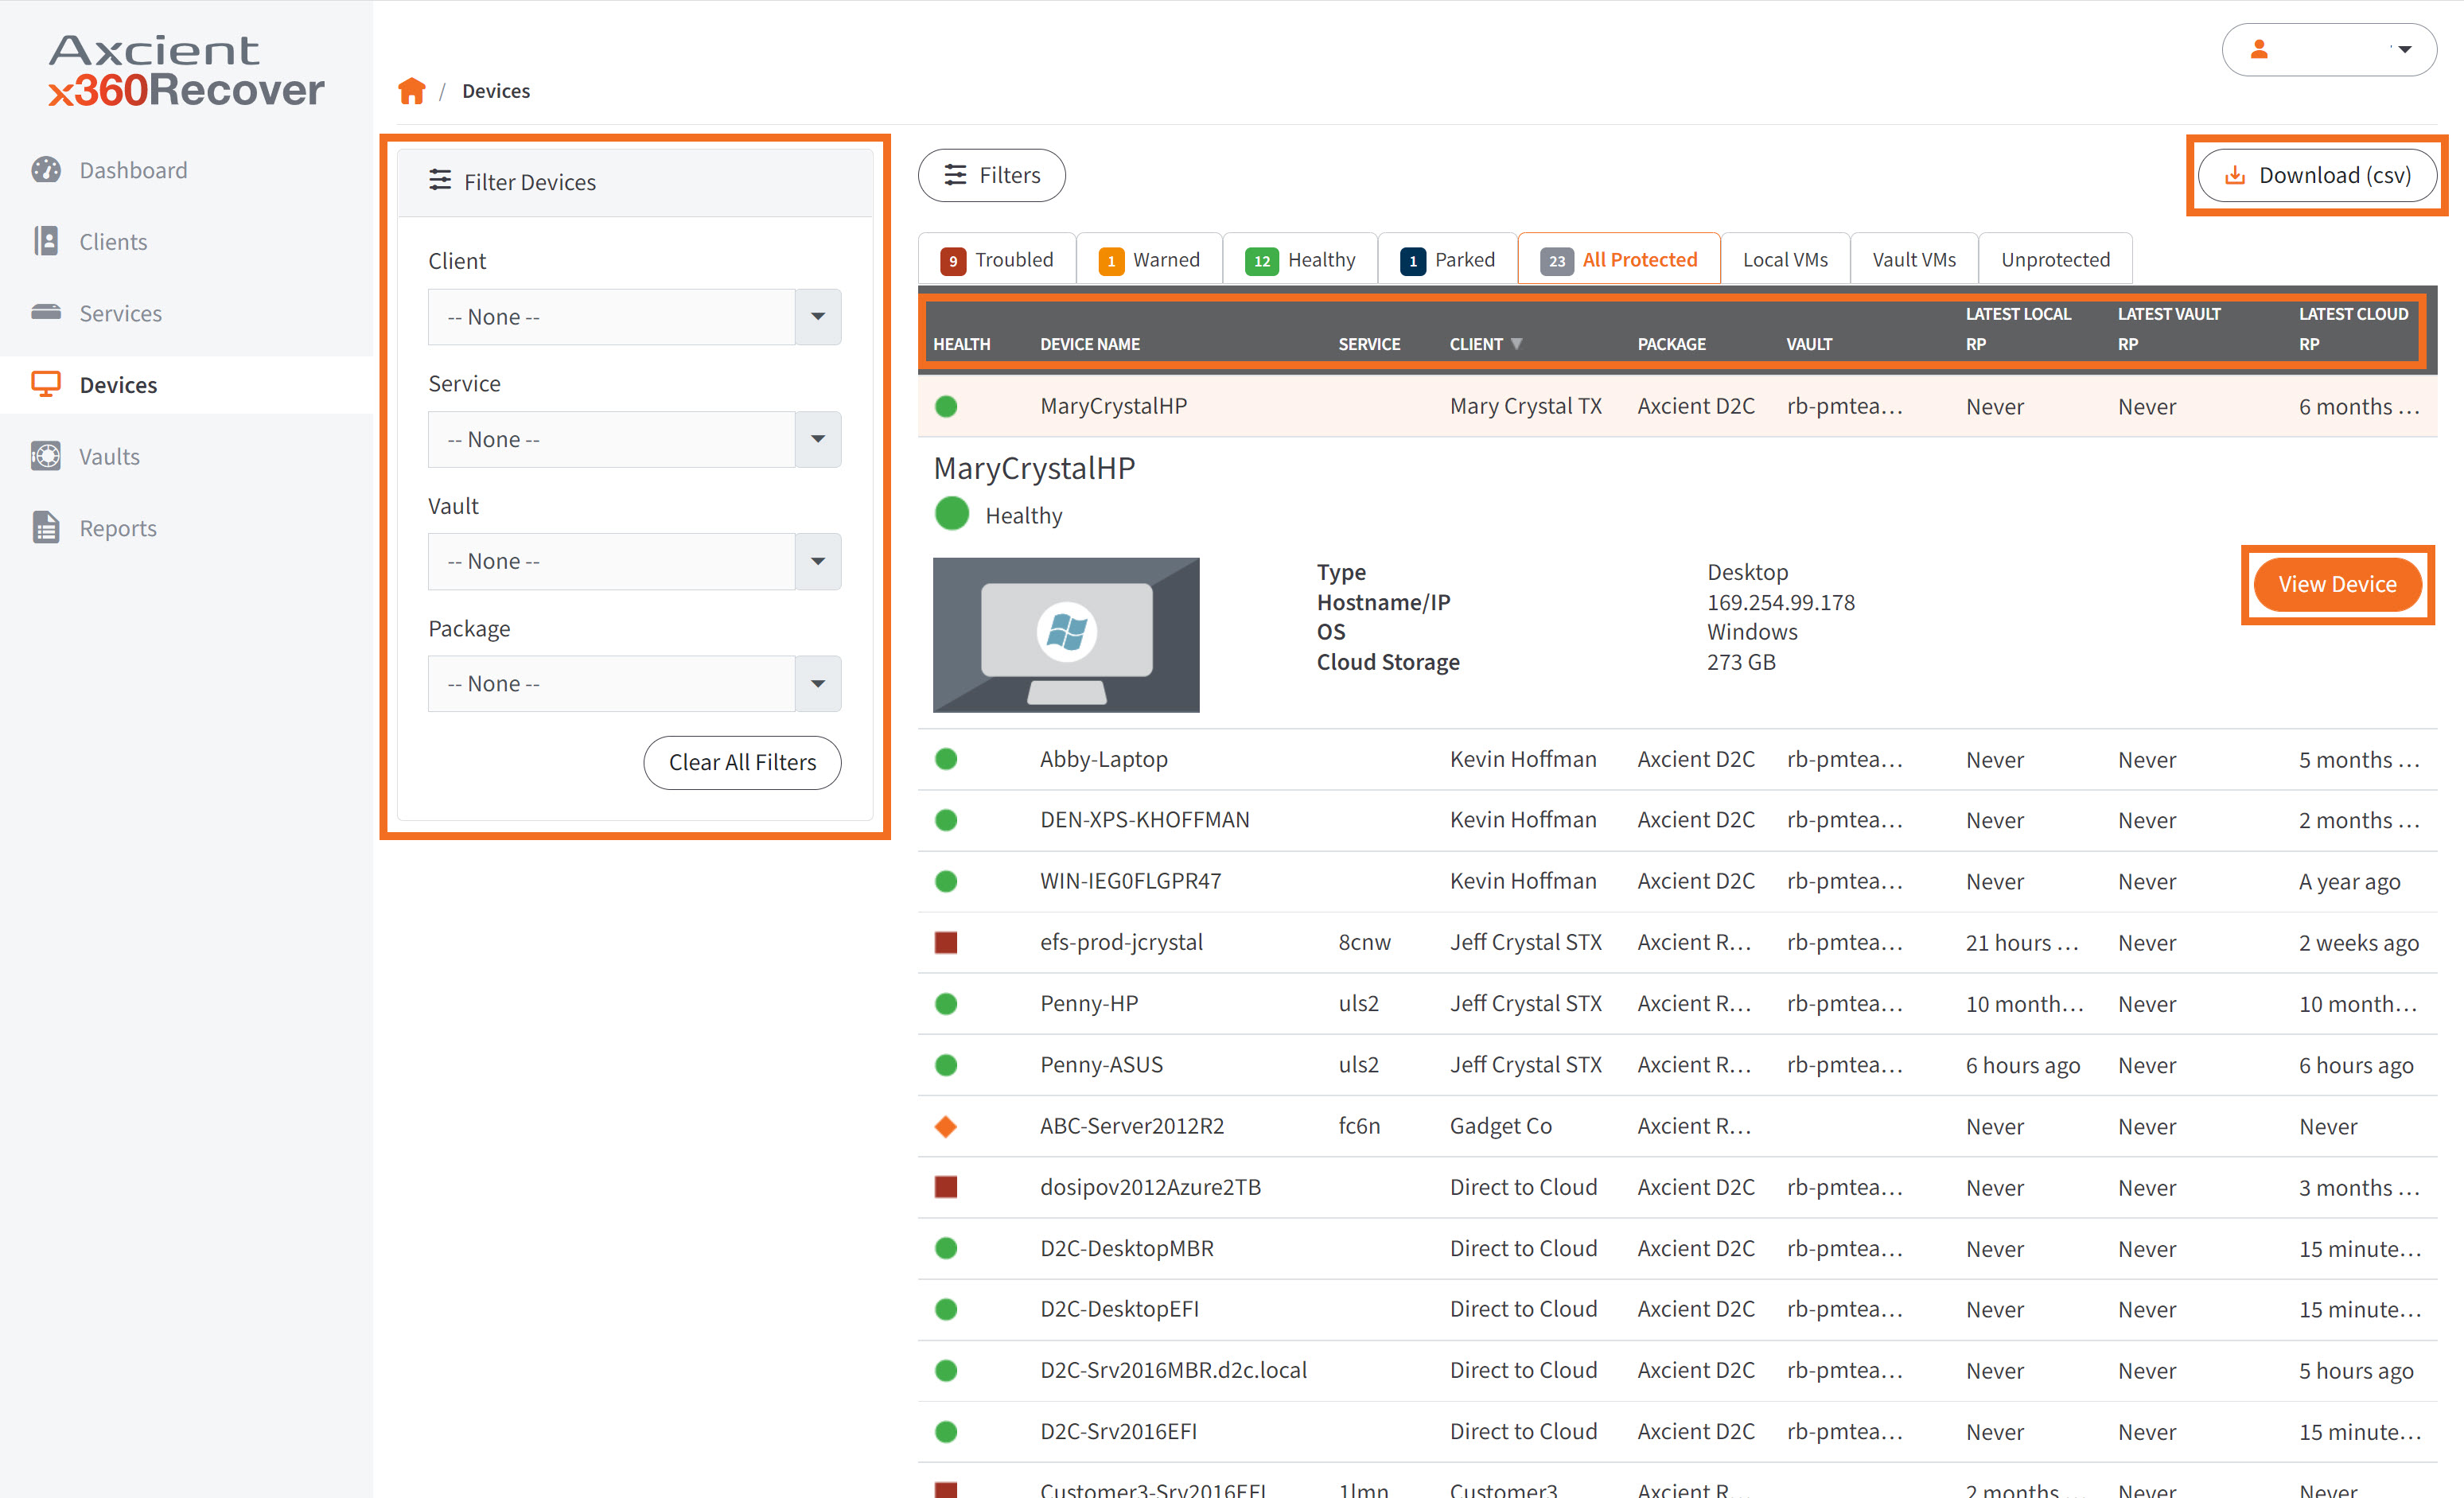
Click the Download (csv) button to download a csv list of all devices. It includes all of the data from the table, including Health Status and Latest Local/Vault/Cloud Replication.
Click into the Device Name to view its Device Details page. Alternatively, click anywhere else in the row to expand the row and view more details. Click the View Device button to view its Device Details page.
Device details
The Device Details page displays a detailed view of the health status and BooVM/volume mount checks, as well as summaries of protection, storage, and Geo+
1. From the Actions section on the top right, you can quickly launch a recovery workflow by clicking on the Recovery Wizard button. You can recover file or folder data, run a virtual machine within the Axcient Virtual Office cloud, export a virtual disk to be used for a bare metal restore or other type of recovery.
2. You can also enable or disable Geo+ for a specific protected system from the Actions section. Geo+ adds an additional layer of protection by creating a geo-redundant copy of the protected systems. Learn more about Geo+ and configuration options here.
3. You can click the Alert Settings button to set custom alert thresholds for this device. Note that changes will override the default thresholds set at the client or service level.

With the release of RMC 6.0, the Device Details page now shows Job History information.

The Job History table includes status of the job, job type, start and end time, duration, and size.
Please note that the “size” column represents the deltas included in the snap shot, not the total size of the backup if it was to be used in a recovery.
Clicking the info-icon will show a legend of the different job statuses and types: initial backup, backup, and replication.

Additionally, clicking the job status brings up job details as well as any error message associated with the job. Users can copy errors.
 .
.
5. Vault settings for x360Recover Manager
5. Vaults
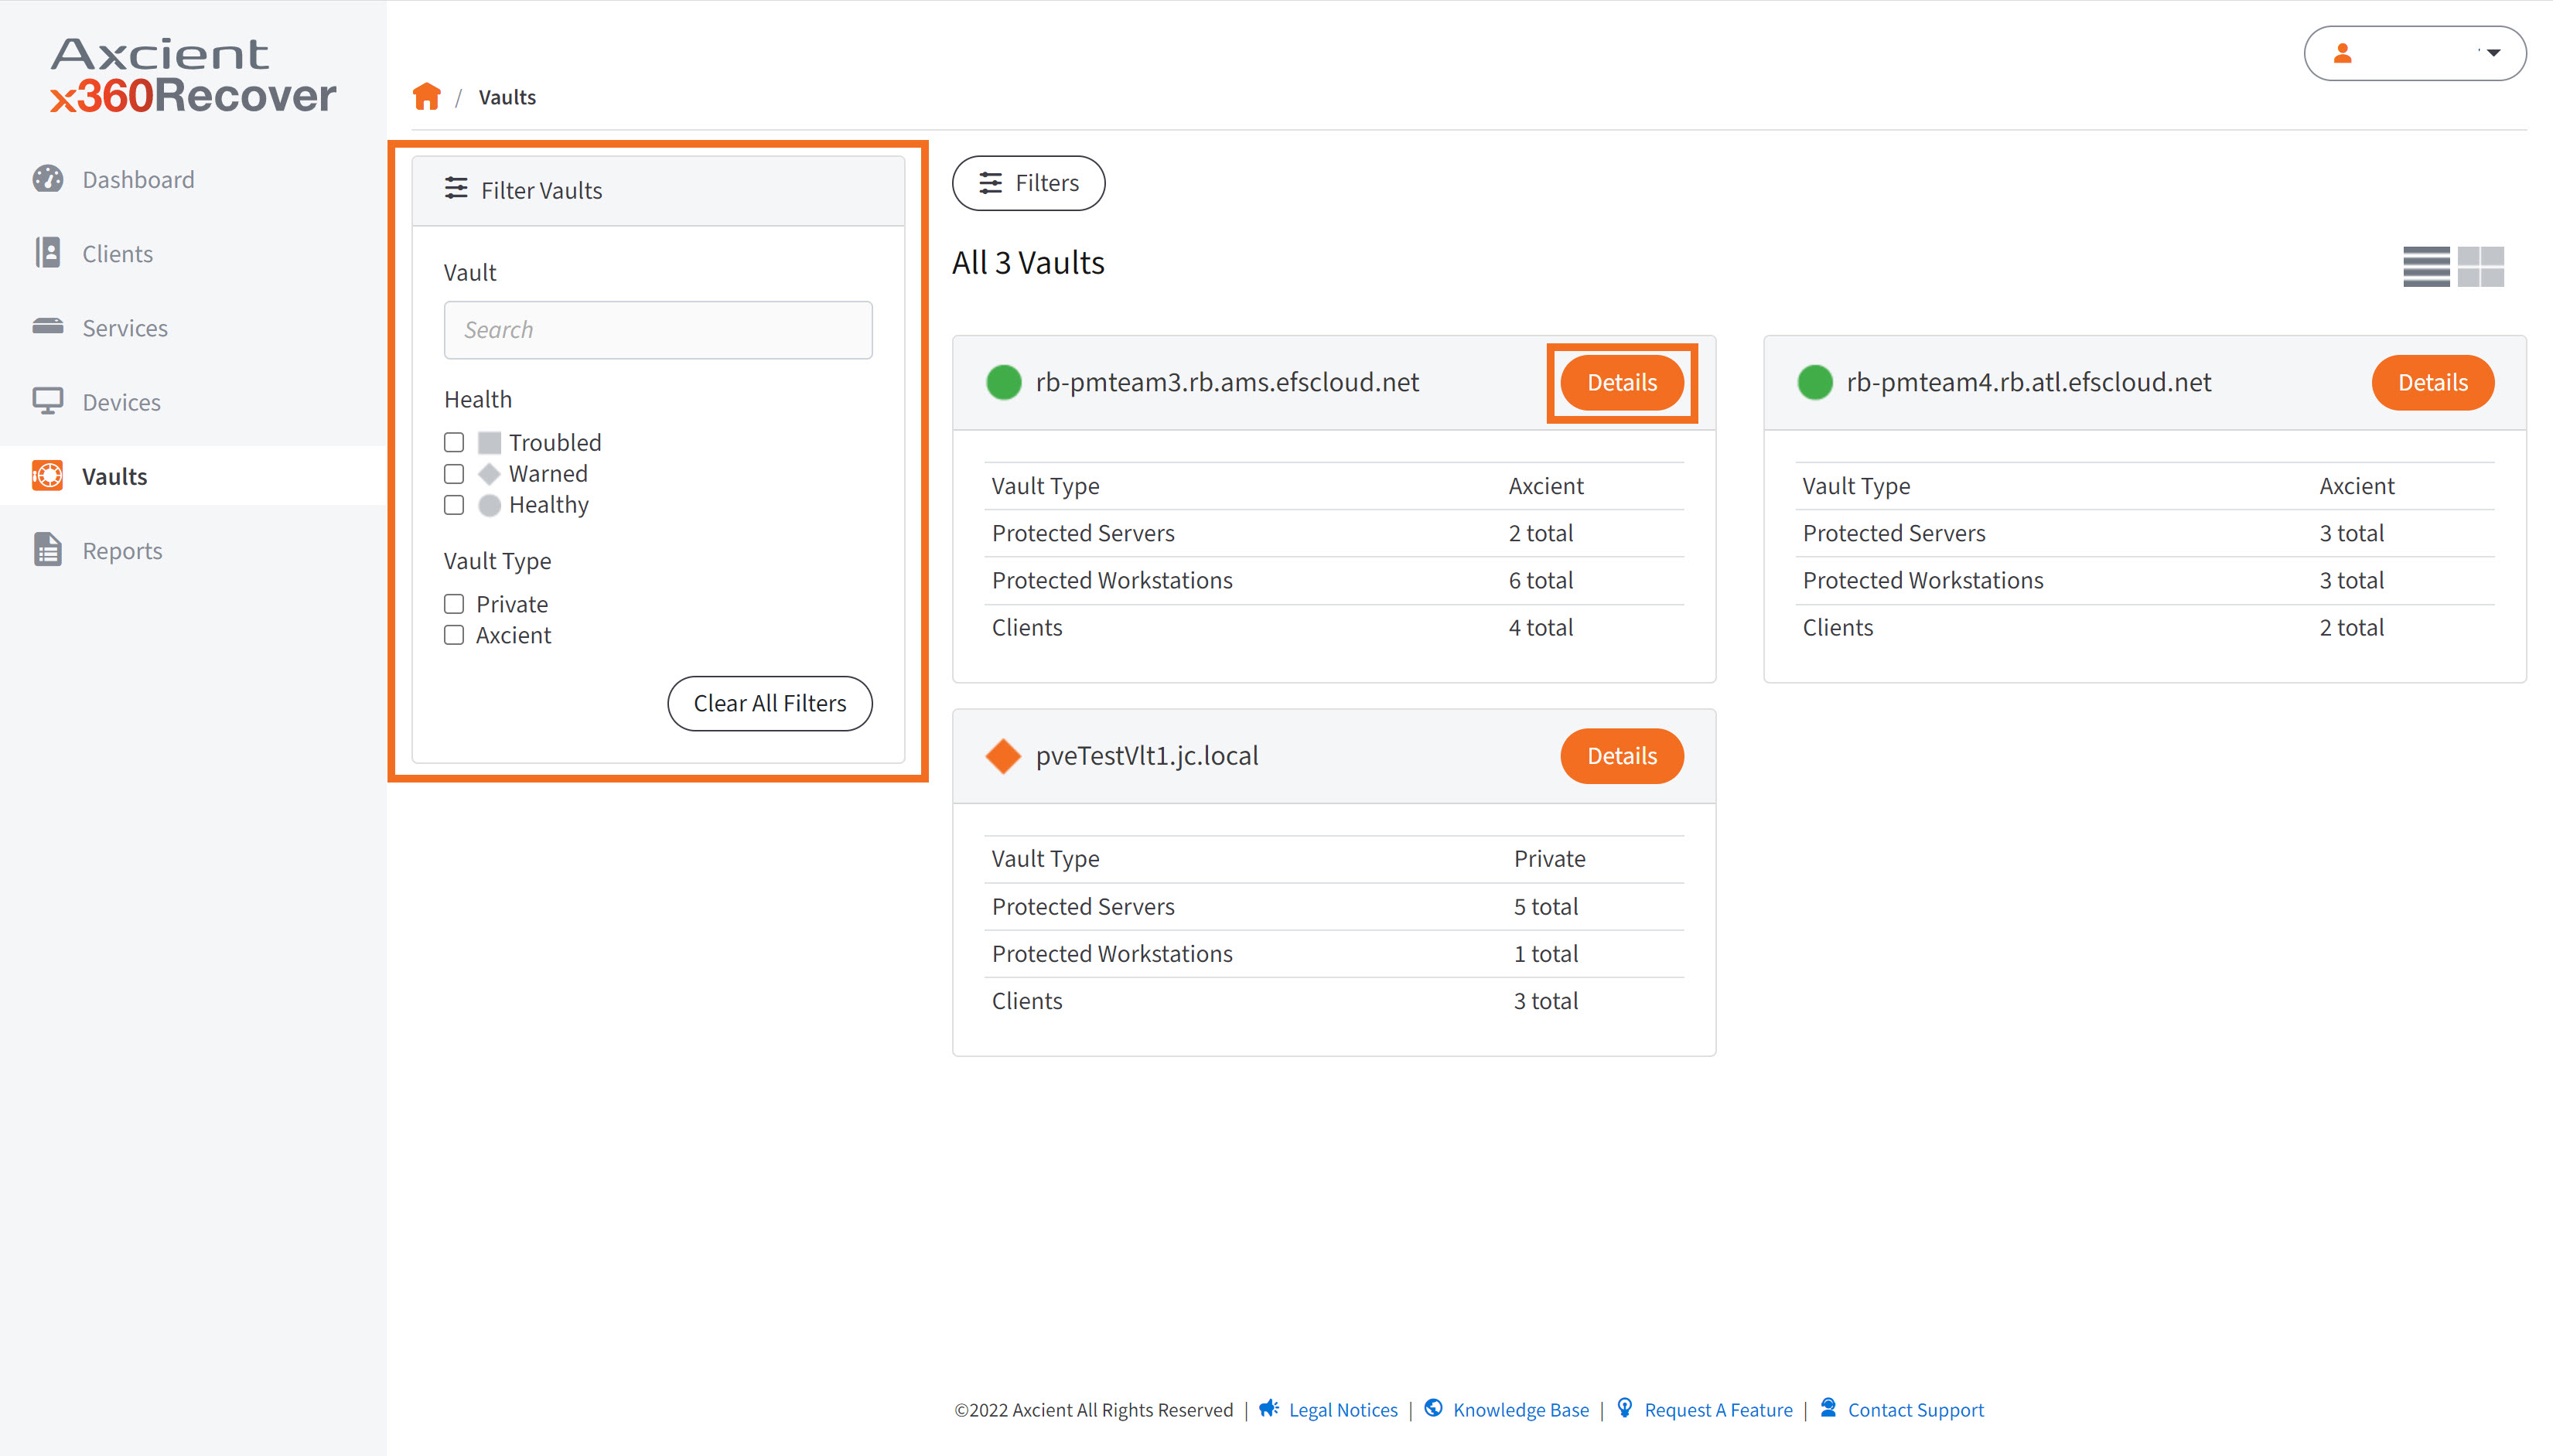
The Vaults page provides a summary of the vaults you have and their status. You can use the Filter Vaults menu to filter vaults by vault name, health status, or vault type.
You can click the Details button of a particular vault to see that vault's Vault Details page.
Vault details
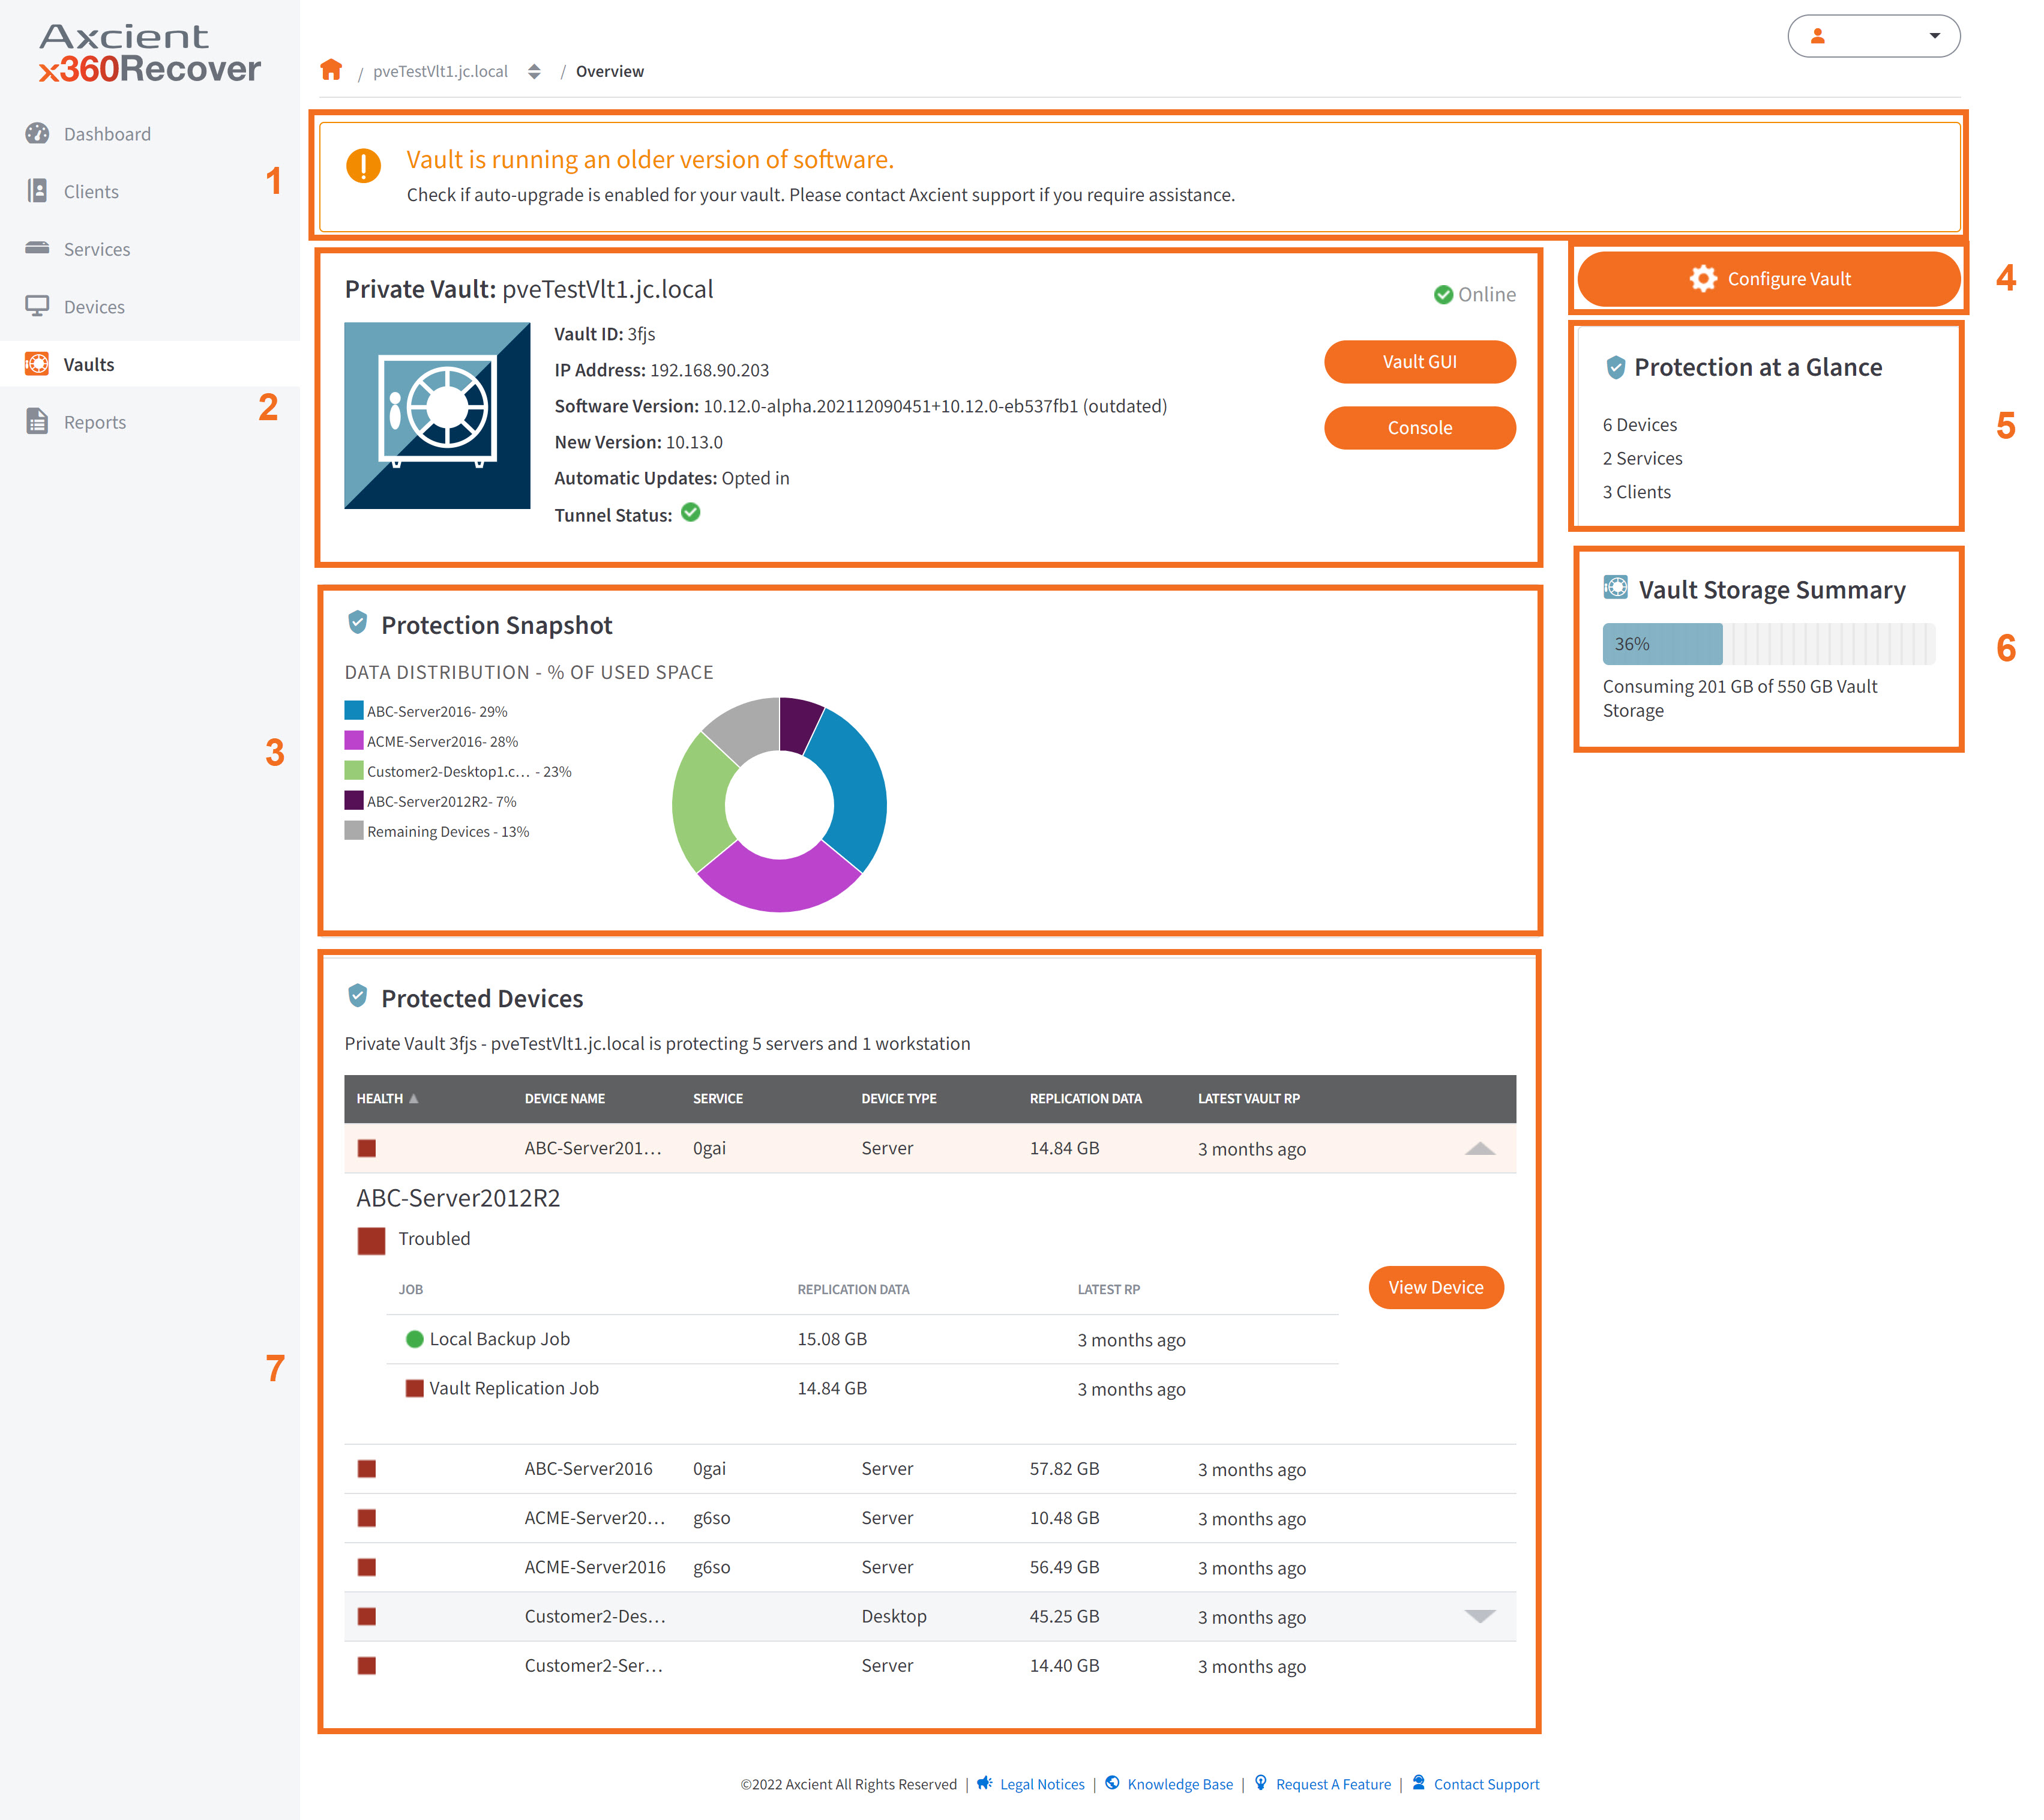
The Vault Details page displays a view of the health status of the Vault and also provides information to help you monitor the Vault and devices. The Vault Details page will vary slightly depending on whether you are working with a Private Cloud Vault or an Axcient Cloud Vault.
- Vault Message - If the vault is troubled or has warnings, this banner will explain the health status.
- Vault Summary - This panel displays summary information, including Vault ID, IP Address, Software Version, Automatic Updates (opted in or not), and Tunnel Status. Click the Vault GUI button to log into the vault. Click Console to enter the Admin Console.
- Protection Snapshot - This panel shows the services within the vault, and how much data each consumes.
- Configure Vault - Click this button to edit vault alerts and thresholds.
- Protection at a Glance - This panel shows what devices, services, and clients are being protected by the vault.
- Vault Storage Summary - This panel shows how much data is being stored in the vault.
- Devices - This is a list of devices protected by the vault. Click into a Device Name to view the Device Details page. Click anywhere else in the row to expand and view the jobs within that Device. Click the View Device button to view the Device Details page.
6. User settings for x360Recover Manager
NOTE on direct user logins: x360Recover Manager is accessed at my.axcient.net for direct user logins.
How do I manage x360Recover users?
You can choose to manage x360Recover users with several methods, depending on the type of user account.
For complete details, please see Manage x360Recover users
METHOD #1: Manage x360Recover users, directly from within x360Recover Manager:
- Users created within x360Recover Manager exist solely within the scope of x360Recover and will not have access to other Axcient products.
- Within x360Recover Manager, you may now create multiple client user accounts, to provide clients with direct access to x360Recover Manager or Recovery Center with MFA.
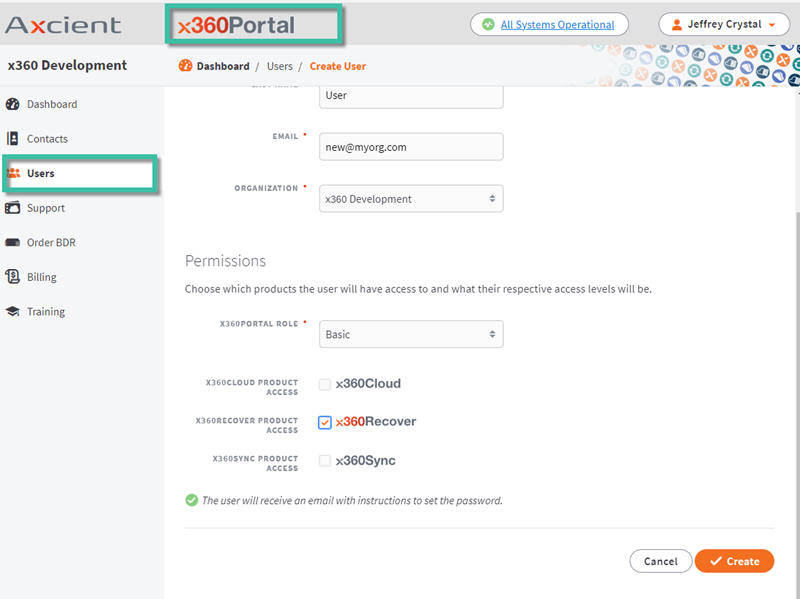
METHOD #2: Manage users affiliated with your organization (technicians and administrators) in the x360Portal.
- Users affiliated with your organization (technicians and administrators) are typically managed in Axcient's top level x360Portal at partner.axcient.com.
- Users created in the x360Portal may be assigned access to all of Axcient's product suites, including x360Recover, x360Sync and x360Cloud.
- Users set up in x360Portal may also be further managed within Recover Manager to assign or remove more granular roles and permissions.
For complete details, please see Manage x360Recover users
Delete7. Licenses for x360Recover Manager
For complete details, please review Manage licenses inx360Recover Manager
Where will I manage my x360Recover licenses?
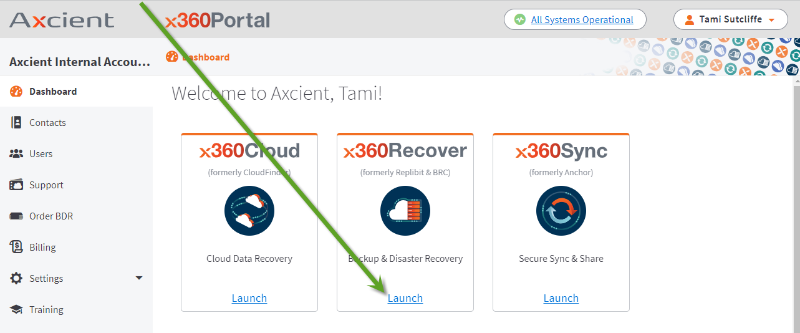
STEP 1. Log into your x360Portal Dashboard.
STEP 2. Select the x360Recover tile to launch the x360Recover Manager (RMC) dashboard.
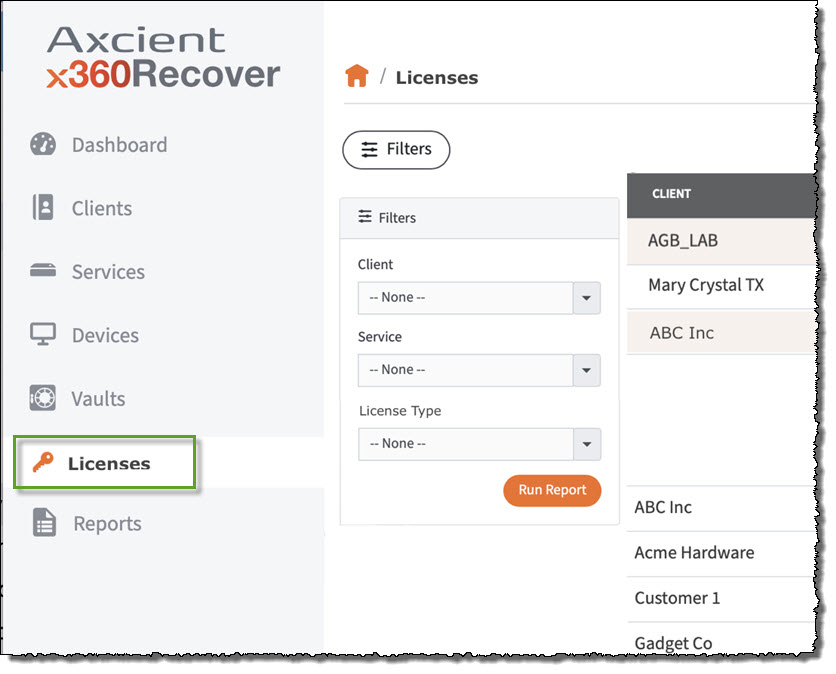
STEP 3. To manage licenses for your x360Recover clients, click Licenses on the left menu:
Once I log in, what actions can I take?
STEP 4. The licensing information detail page will display all of your clients and their current license assignments.
A. Click any CLIENT to expand their entry and review the types of licenses this client currently has assigned.
B. For end point licenses, you will see a summary of how many server and work station licenses are allocated to this client
C. For storage licenses, you will find a summary of the allocated storage being used by this client, along with the assigned retention period.
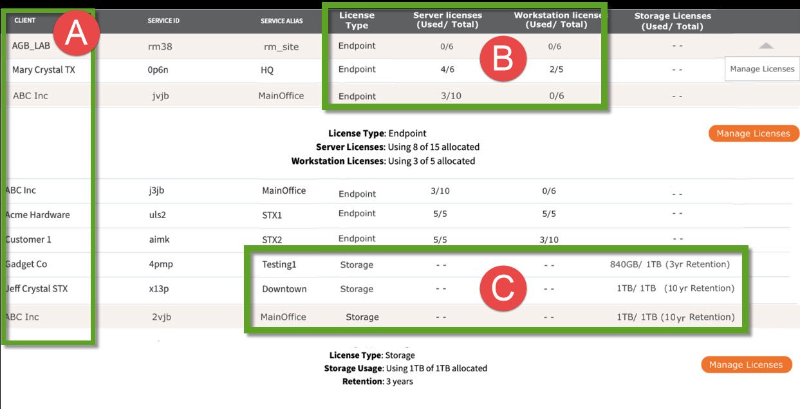
STEP 5. Click Manage Licenses to assign, edit or change license assignments for that client.
What is the workflow for adding a new appliance?
Important note on new appliance licenses: The license provisioning process for new appliances has changed since our legacy License Portal was retired.
As of October 24, 2023, you are no longer required to create locations or sites when assigning licenses for appliances. Instead, new appliances will appear within the Licenses page automatically, once they have been provisioned.
Steps to add a license for a new appliance:
1. Create the client (if the client does not yet exist)
2. Install x360Recover on your BDR (if you are using BYOD hardware)
3. Provision the new BDR by connecting to the appliance IP address with a web browser and completing the registration wizard
4. Assign licenses within x360Recover Manager from the Licenses tab, as described above
5. Once the provisioning process has been completed, the new appliance will appear within x360Recover Manager under 'Services' 'Clients' and 'Licenses'
Delete8. Reports for x360Recover Manager
Reports
- For detailed discussion of all reporting functions in x360Recover Manager, please review Reports in x360Recover Manager
There are two sets of tabs that organize Reports.
The top row of tabs separates x360Recover Reports and D2C reports.
- The Definitions tab allows you to view, edit, or delete reports emailed on a daily, weekly, or monthly basis.
- The Auditor tab allows you to filter by certain type of system actions to generate a report useful for auditing purposes.
- The Notifications tab shows a list of notification history.

The second row of tabs designates the type of report; options vary depending on if x360Recover Reports or D2C is selected.
Use the dropdown menus in the Filters panel to narrow down your results, then click Run Report to see the report data.
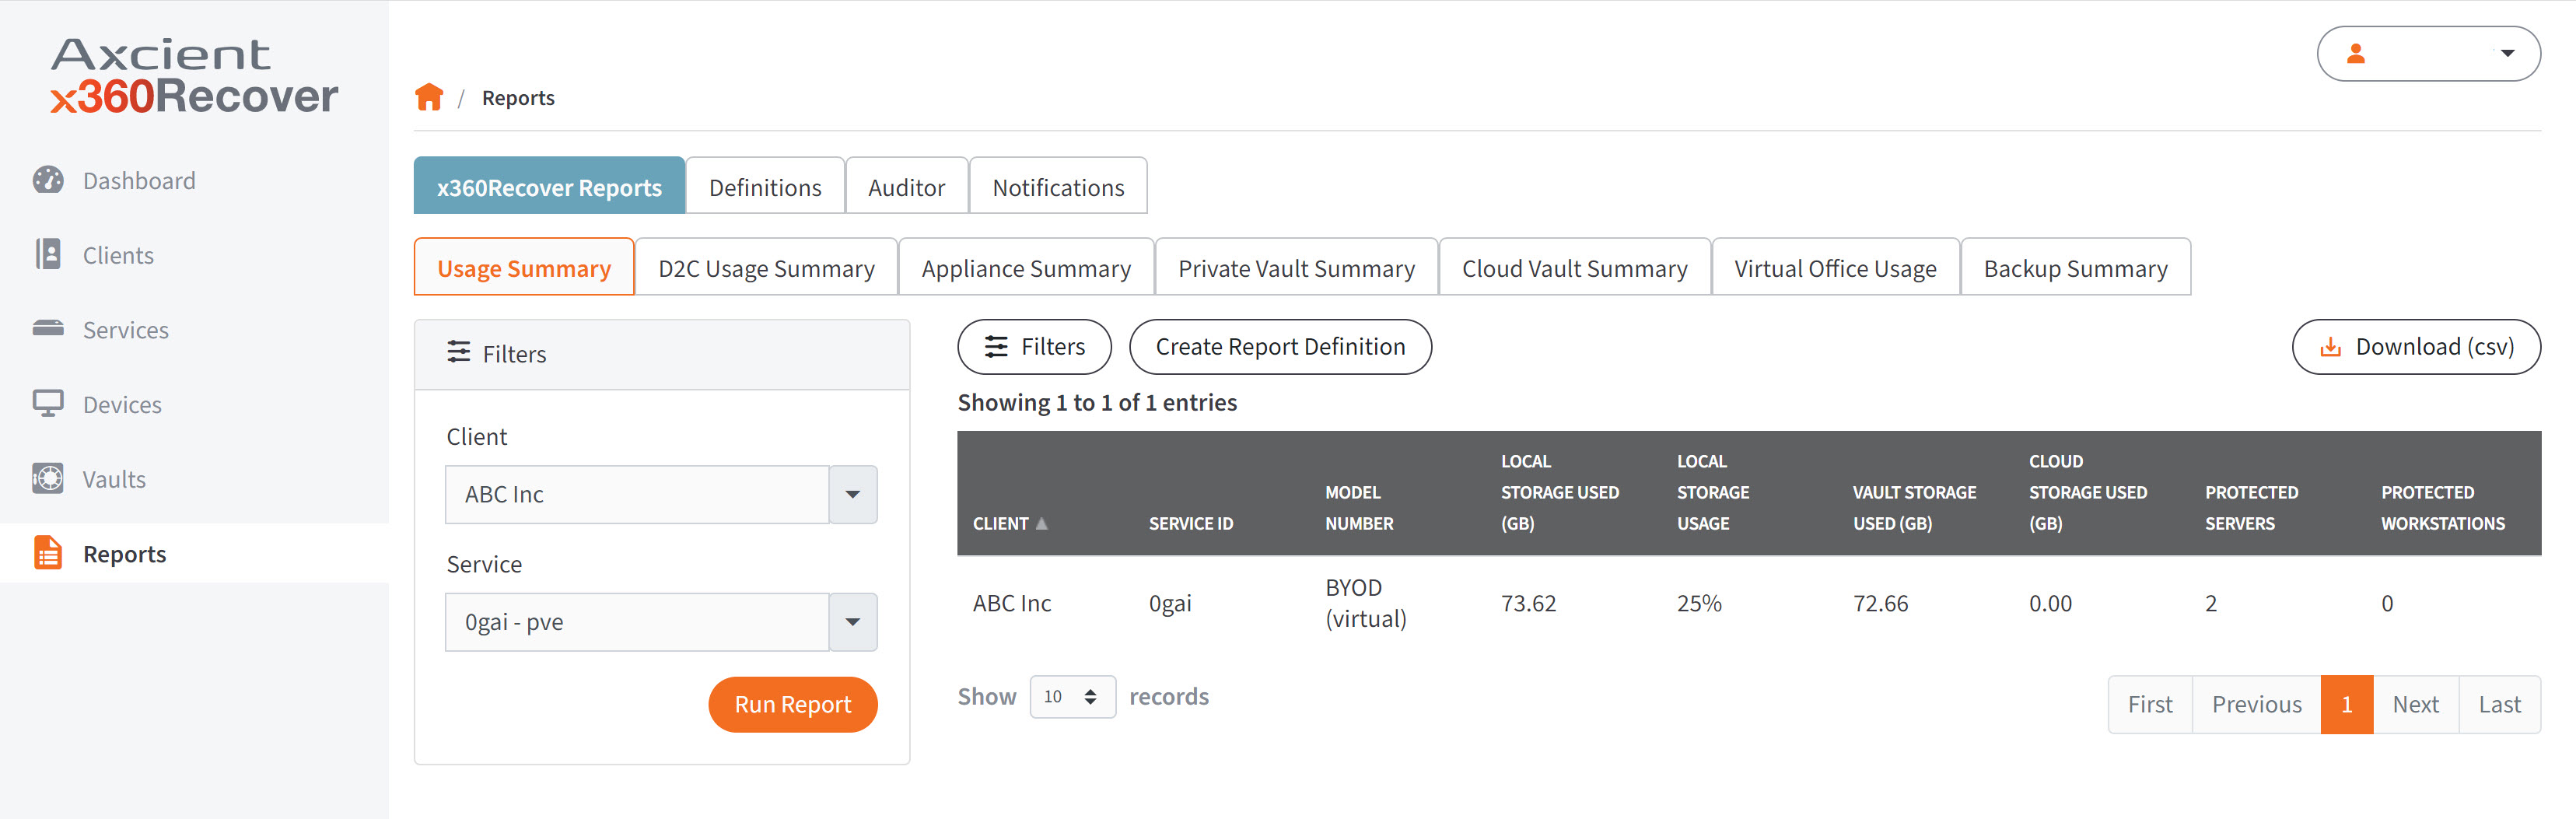
Once a report is run, you can click the Create Report Definition button to save the report and email it on a daily, weekly, or monthly basis. You can edit or delete these schedules in the Definitions tab in the top row.

Click the Download (csv) button to download the report as a one-time CSV file.
For detailed discussion of all reporting functions in x360Recover Manager, please review Reports in x360Recover Manager
DeleteSUPPORT | 720-204-4500 | 800-352-0248
- Contact Axcient Support at https://partner.axcient.com/login or call 800-352-0248
- Free certification courses are available in the Axcient x360Portal under Training
- Subscribe to the Axcient Status page for updates and scheduled maintenance
1641