
Monitor an organization dashboard
When you first log in to an organization, you will be presented with the Dashboard page. You can use this page to view connected services, activity reports, and backup statistics.
To monitor the Dashboard:
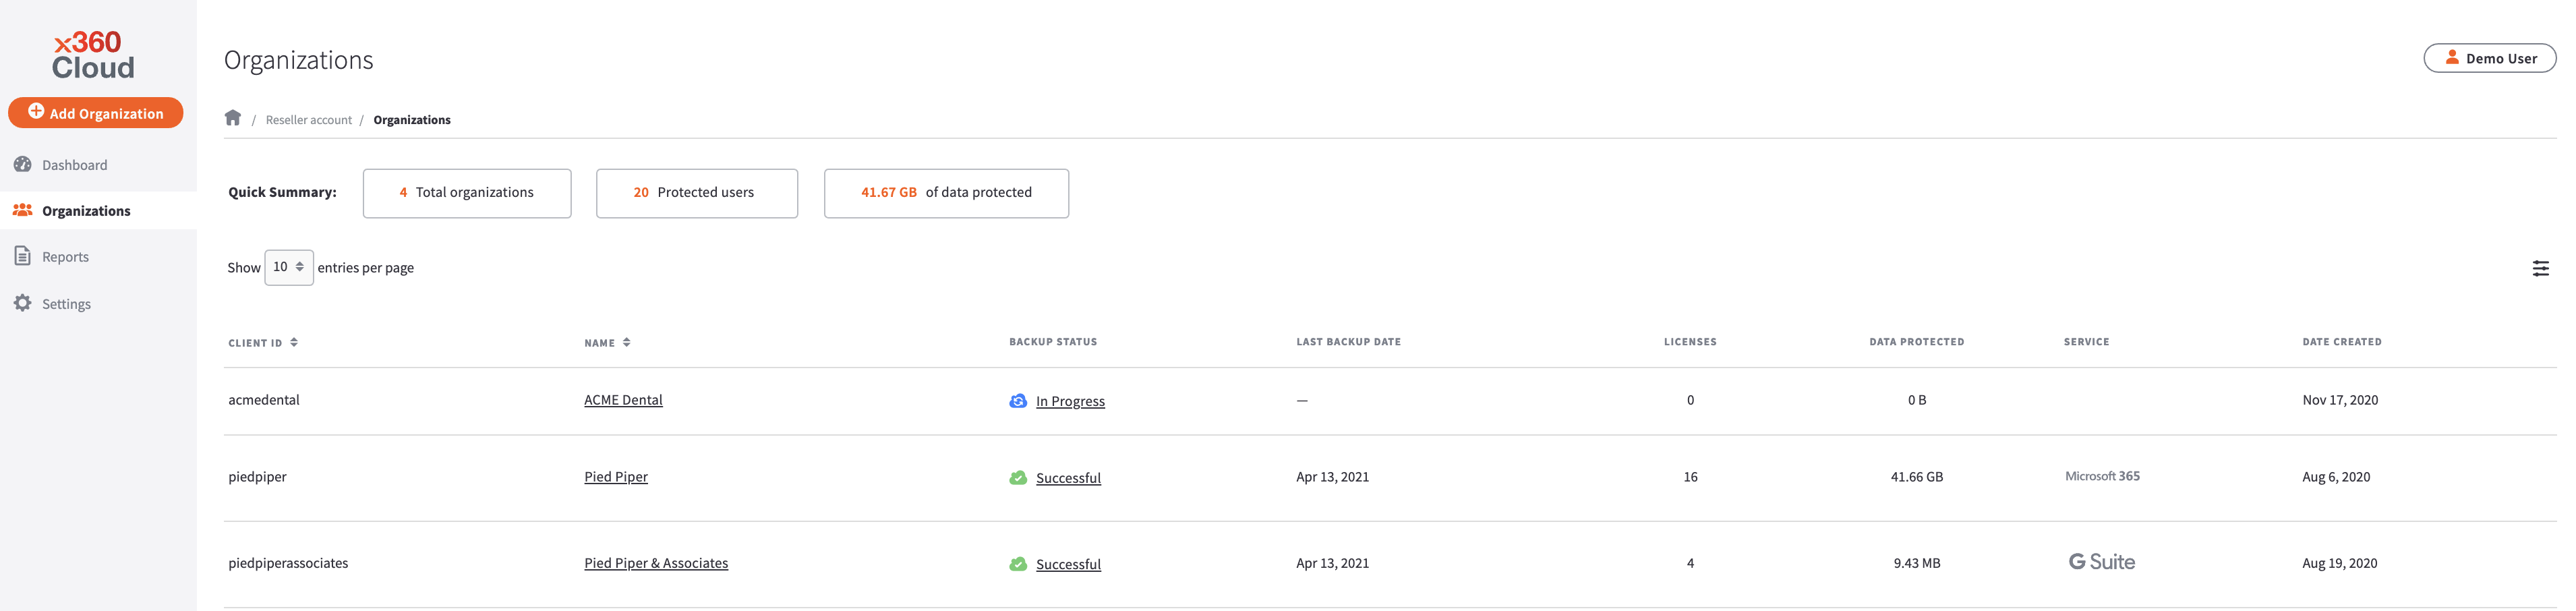
- In the Reseller Portal Organizations page, click the name of the organization you want to manage. The client account Dashboard page displays, giving you access to client account details and reports.
- In the Dashboard page, use the Backup Status panel to view the current backup status. You should see the latest backup is in progress, successful, partially successful, or failed.

- You can download a history by clicking the Generate Backup Report button. When the report is processed, the organization's Reports page will be updated with the most up-to-date information; previously run reports are viewable by clicking the Reports of the day dropdown button.

- You can download a history by clicking the Generate Backup Report button. When the report is processed, the organization's Reports page will be updated with the most up-to-date information; previously run reports are viewable by clicking the Reports of the day dropdown button.
- You will also see a total number of protected users and protected Microsoft SharePoint sites or Google shared drives. Use the graphical display chart to see a breakdown of space quota.
- Click the By item size radio button to view a breakdown of each backup object type by space quota.
- Click the By number of items radio button to view a breakdown of each backup object by number of items.

- In the Recent Activity Reportpanel, view summary information for the most recent Backup and Restore reports.
- Click the Backup tab to view the backup status (including in progress, success, warning, or failure), the amount of data backed up, the number of users and sites backed up, and the number of objects backed up.
- Click the Restore tab to view the start and end date of each restore process, the status of the restore process, number of objects restored, and the total time spent on the restore process.
